thread830-460176
I guess there are 2 problems here.
1. Process
Due to lack of information, I can only guess, but there are always elastic deformations in pressurized systems. Also pay attention the stabilized process curves t= 3:55:50 - 3:55:55. The PI curve can be approximately taken as a step, the pressure curve has an overshot, i.e. the process/plant itself is oscillatory.
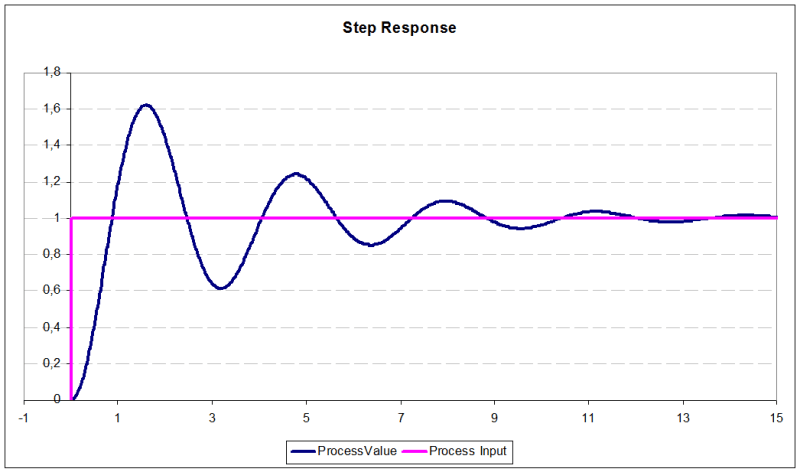
To illustrate the problem, let's set the process/plant transfer function:
W(s) = 1/ (T^2 * s^2 + 2*T*f*s + 1)
T = 0.5
f = 0.14
(this function is not an exact model of the OP's process/plant - just an illustration of the problem)
Below is the step response curve.
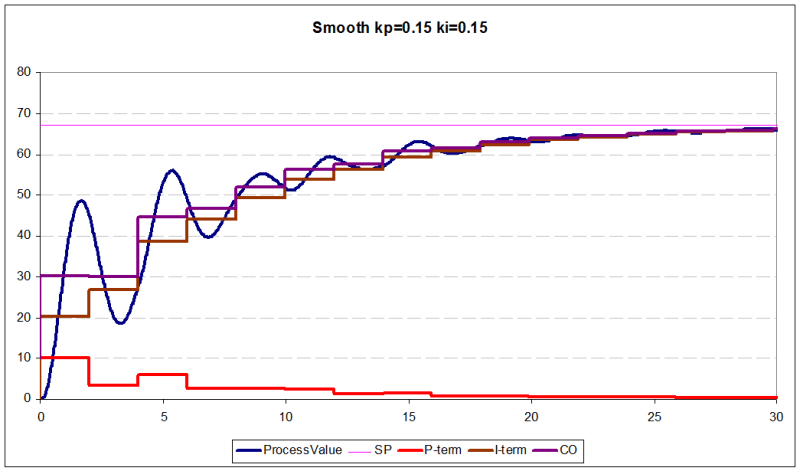
Stabilized (smooth) process curves (kp = 0.15 ki = 0.15)
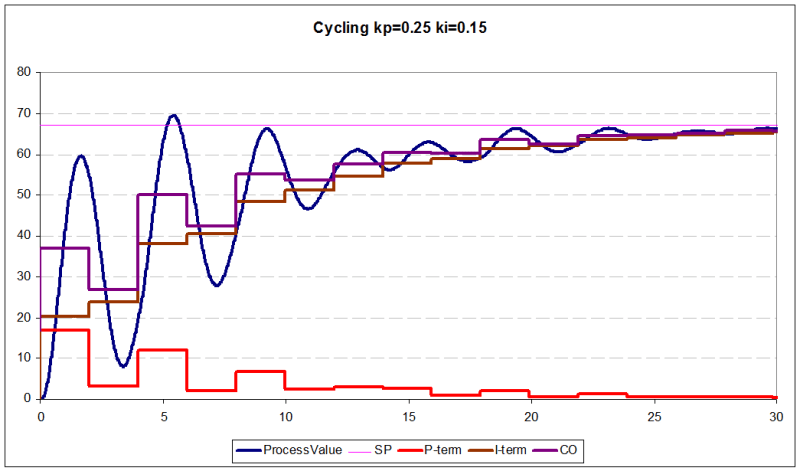
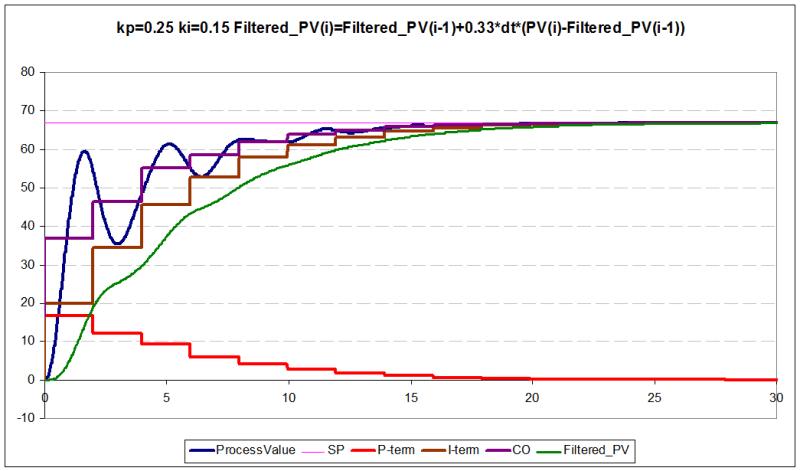
Cycling process curves (kp = 0.25 ki = 0.15)
Close loop TF
W(s) = (kp*s + ki) / (T^2 * s^3 + 2*T*f* s^2 + s *(1+kp) + ki)
It has 3 poles and (if kp!=0) 1 zero. Zero does not compensate for the pole, therefore it adds vibrations.
Problem 1 solution: apply Kp=0
2. Downsampling or Wagon-wheel effect.
kp = 0.25 ki = 0.15 loop update rate dt = 0.01
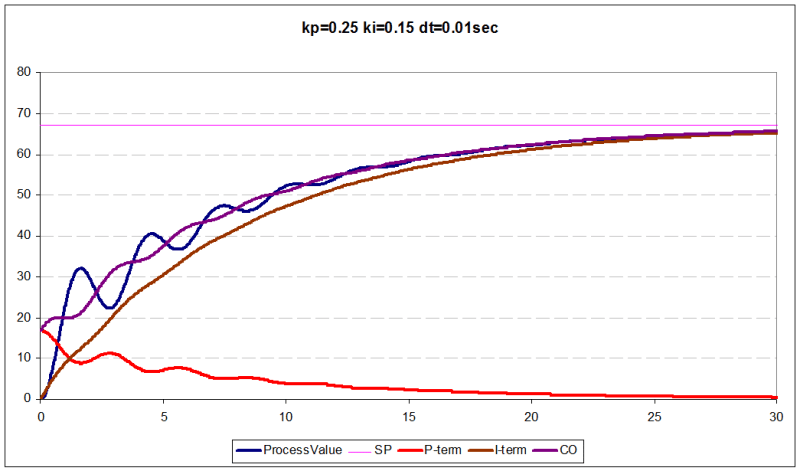
The only difference between Cycling process curves and graph above is loop update rate (Cycling process dt = 2 sec, graph above dt = 0.01 sec)
The cycle update rate is not enough to control a process with such high frequency characteristics (control is carried out on a "false signal").
You can solve the problem in two ways:
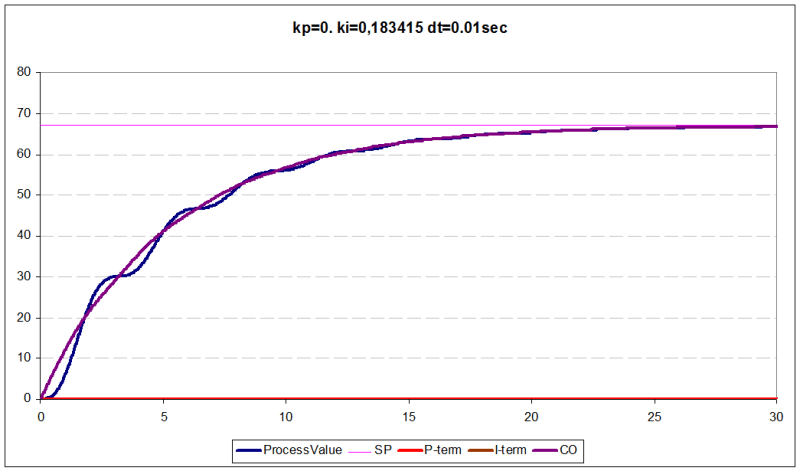
- reduce dt (as in the graph above)
- get rid of the high-frequency component of the signal, for example by applying a low-pass filter
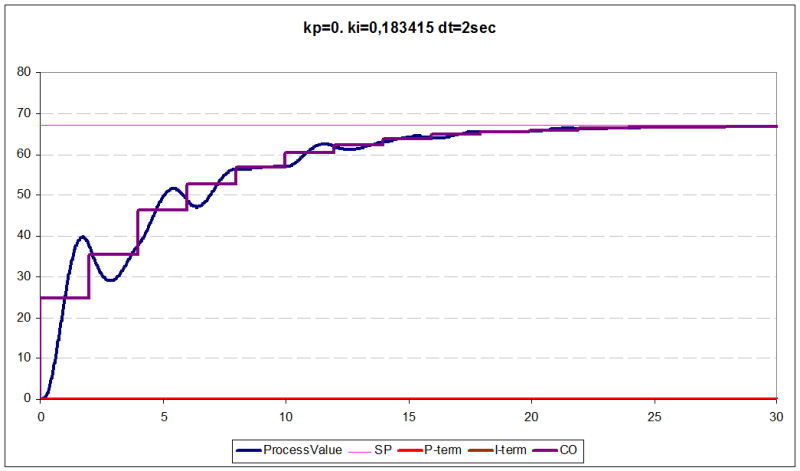
or apply I-only controller (kp=0 ki=0.183415)
although the “ideal” curve for this process
I guess there are 2 problems here.
1. Process
Due to lack of information, I can only guess, but there are always elastic deformations in pressurized systems. Also pay attention the stabilized process curves t= 3:55:50 - 3:55:55. The PI curve can be approximately taken as a step, the pressure curve has an overshot, i.e. the process/plant itself is oscillatory.
To illustrate the problem, let's set the process/plant transfer function:
W(s) = 1/ (T^2 * s^2 + 2*T*f*s + 1)
T = 0.5
f = 0.14
(this function is not an exact model of the OP's process/plant - just an illustration of the problem)
Below is the step response curve.
Stabilized (smooth) process curves (kp = 0.15 ki = 0.15)
Cycling process curves (kp = 0.25 ki = 0.15)
Close loop TF
W(s) = (kp*s + ki) / (T^2 * s^3 + 2*T*f* s^2 + s *(1+kp) + ki)
It has 3 poles and (if kp!=0) 1 zero. Zero does not compensate for the pole, therefore it adds vibrations.
Problem 1 solution: apply Kp=0
2. Downsampling or Wagon-wheel effect.
kp = 0.25 ki = 0.15 loop update rate dt = 0.01
The only difference between Cycling process curves and graph above is loop update rate (Cycling process dt = 2 sec, graph above dt = 0.01 sec)
The cycle update rate is not enough to control a process with such high frequency characteristics (control is carried out on a "false signal").
You can solve the problem in two ways:
- reduce dt (as in the graph above)
- get rid of the high-frequency component of the signal, for example by applying a low-pass filter
or apply I-only controller (kp=0 ki=0.183415)
although the “ideal” curve for this process