Continue to Site

Eng-Tips is the largest engineering community on the Internet

Intelligent Work Forums for Engineering Professionals

  • Congratulations IDS on being selected by the Eng-Tips community for having the most helpful posts in the forums last week. Way to Go!

ABAQUS; Bilinear Force Displacement Curve

Status
Not open for further replies.

Entherm

Civil/Environmental
Sep 23, 2020
34
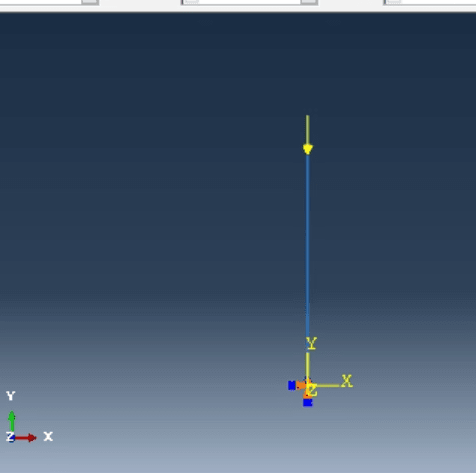
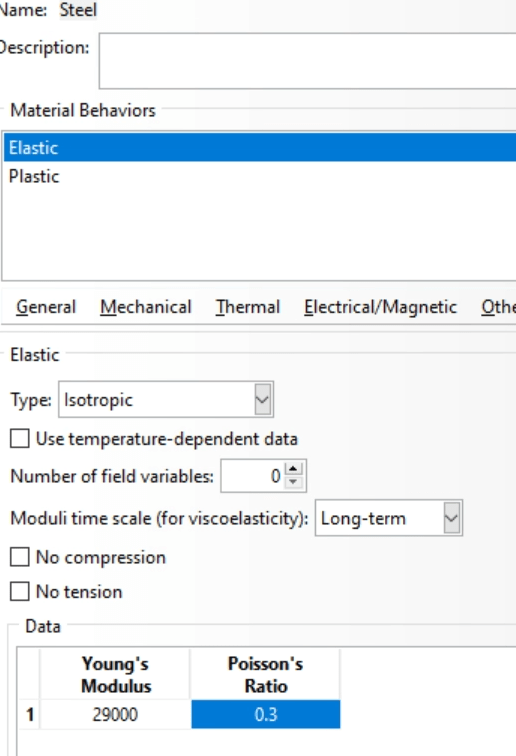
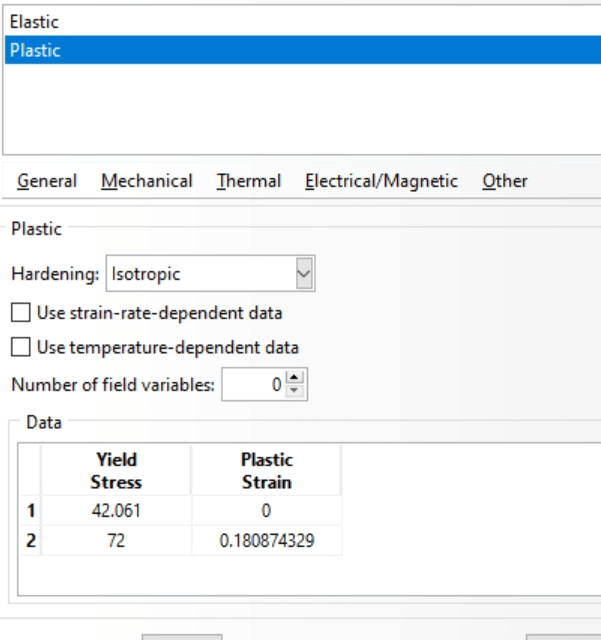
In the ABAQUS, my member is a beam 127.5625 in. long with a uniform rectangular cross-section of 3.5 in2. I input a bilinear steel property with true stress of 42.06 ksi, plastic strain 0, and ultimate true stress of 72 ksi and plastic strain 0.18. This came from a yield point of 42 ksi and ultimate stress of 65 ksi.

Issue4_yrd0zw.png


Issue5_qqzsiq.png


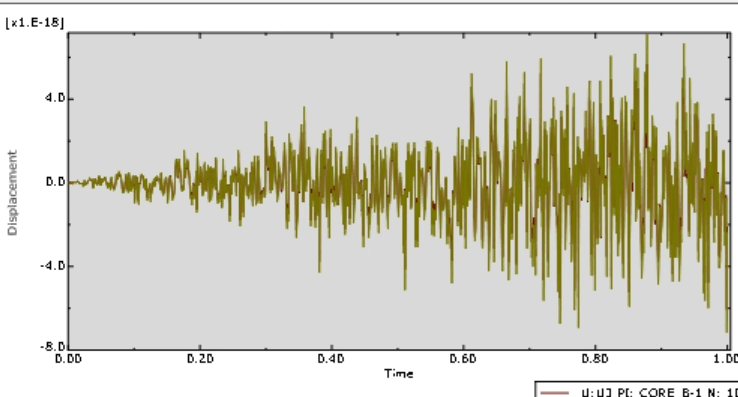
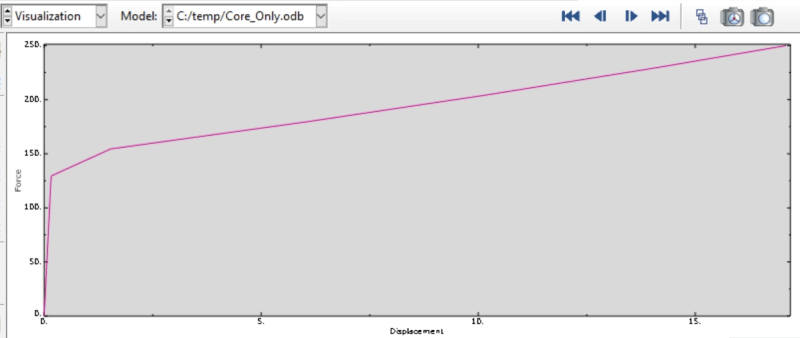
When I applied a compressive load of 250 kips, I, however, get the following force-displacement curve. Based on the area and yield point, my yield force would be 147 kips and the ultimate point of 227 kips. The axial displacement from ABAQUS does not seem to comply with this. Can I get help on what might be happening?

Issue3_q4z7cr.png
 
Replies continue below

Recommended for you

What are the boundary conditions ? Double check all units to make sure that they are consistent. Also, consider performing simple one element test first.
 
I used a 3D wire beam with one end fixed and the other end has a compressive load of 250 kips.

Issue6_aevwvp.png


I tried using one element and I get the same results. The units are also consistent. Everything is in kips, inches.
 
Thank you. I was able to get better results by changing step increments.
In the same model, I got the following U3 values for the nodes, does the graph make sense? What could be an explanation for this? The values are extremely small but the graph looks weird.
Issue7_fkbm86.png
 
Entherm said:
I was able to get better results by changing step increments.
I think this explains why the first yield point might be off: You're simply not extracting results at the exact instant of yield.

I agree with IceBreakerSours that the U3 results are numerical noise.

A few other observations:
[ol 1][li]Your 72 ksi true stress at 0.18 plastic strain seems to match with a 60 ksi nominal tensile stress, not 65 ksi compressive.[/li]
[li]Your plot seems to show an additional intermediate plastic point that's not shown in your dialog box.[/li]
[li]It will be easier for you to converge in *static using enforced displacement rather than force.[/li][/ol]

The main reason your UTS will not match is that, by default, beam elements do not update their cross-sectional area during an analysis. You must set two things:
[ol 1][li]nlgeom=yes (default=no) in the step[/li]
[li]poisson=0.5 (default=0.0) in the beam section[/li][/ol]
 
"Your plot seems to show an additional intermediate plastic point that's not shown in your dialog box."

Thank you for the response. Yes, the ultimate point is 60 ksi; I seem to have miscalculated that. But I still do not understand the extra plastic point. I tried using a section poison ratio of 0.5, applied displacement instead of force and the analysis is nonlinear throughout but the two plastic points are still there.
 
Sorry, I now believe the "additional point" is also due to the large step increments where history data is reported. You have results available just before yield and then at some displacement after yield which makes it look like an additional inflection point.

Try the "number interval=40" option for your history output to improve resolution.
 
Status
Not open for further replies.

Part and Inventory Search

Sponsor