Struct123ure
Structural
Hi, I am pretty new to Abaqus and have been studying and practicing it intensely.
For the past month I have been trying to get a Force v. Displacement curve for a reinforced concrete beam. The force response I was seeing was not making sense so I simplified it to a homogenous single material concrete beam(no reinforcement to start). I am performing the analysis using the explicit solver because I want to ultimately do dynamic once I build up my knowledge and verify the mdoel is working correctly.
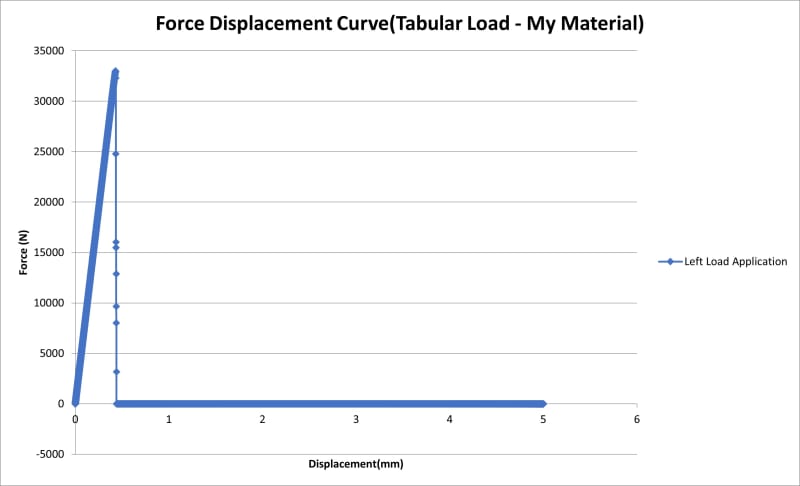
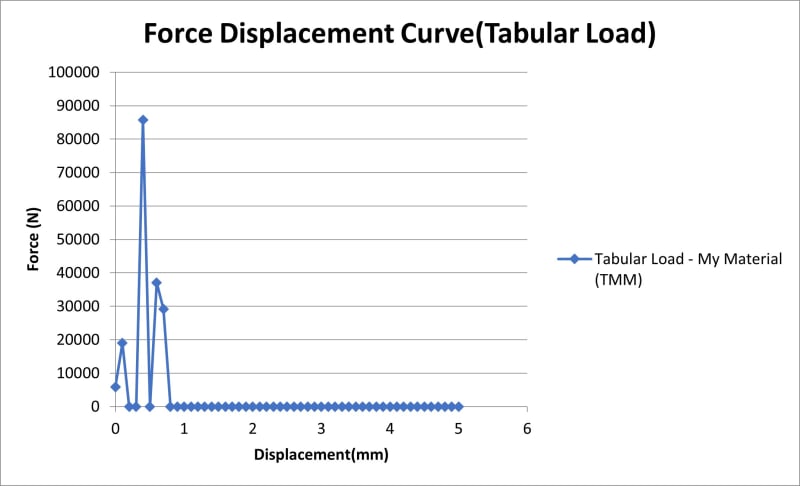
After a month of work and learning till the curve looked like below attached, with very sharp peaks up and down.
I had a breakthrough yesterday where I switched the “Amplitude” from “Type: Tabular” to “Type: Smooth Step” which fixed the beginning of the curve making it look proper, see below:
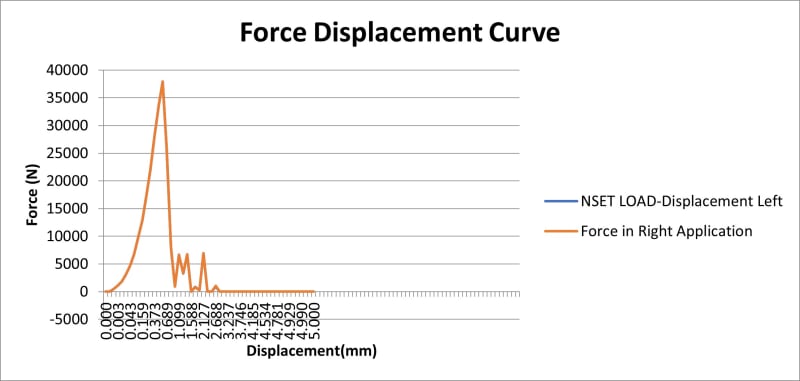
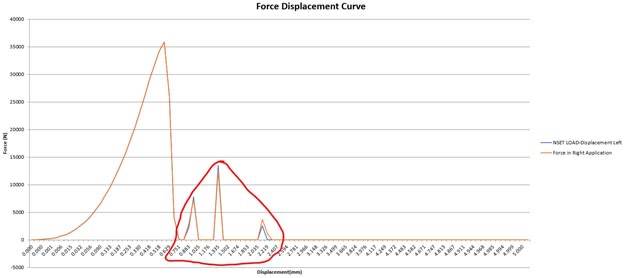
My issue is that after the peak (concrete cracks and elements deleted) it should be a flatline on the bottom, since it has no more capacity.
But there are random peaks after concrete cracks(cicled in red) and I don’t understand why?
I have attached my CAE model file just in case.
For the past month I have been trying to get a Force v. Displacement curve for a reinforced concrete beam. The force response I was seeing was not making sense so I simplified it to a homogenous single material concrete beam(no reinforcement to start). I am performing the analysis using the explicit solver because I want to ultimately do dynamic once I build up my knowledge and verify the mdoel is working correctly.
After a month of work and learning till the curve looked like below attached, with very sharp peaks up and down.
I had a breakthrough yesterday where I switched the “Amplitude” from “Type: Tabular” to “Type: Smooth Step” which fixed the beginning of the curve making it look proper, see below:
My issue is that after the peak (concrete cracks and elements deleted) it should be a flatline on the bottom, since it has no more capacity.
But there are random peaks after concrete cracks(cicled in red) and I don’t understand why?
I have attached my CAE model file just in case.