Eng-Tips is the largest engineering community on the Internet

Intelligent Work Forums for Engineering Professionals

  • Congratulations waross on being selected by the Tek-Tips community for having the most helpful posts in the forums last week. Way to Go!

API 650 - Allowable External Loads on Tank Shell Openings

Status
Not open for further replies.

EmilianoS87

Mechanical
May 5, 2022
13
0
0
AR
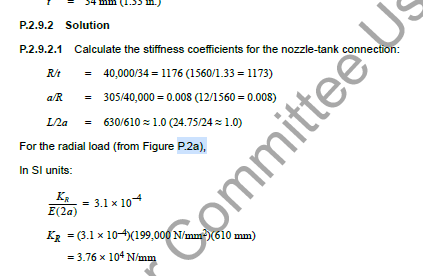
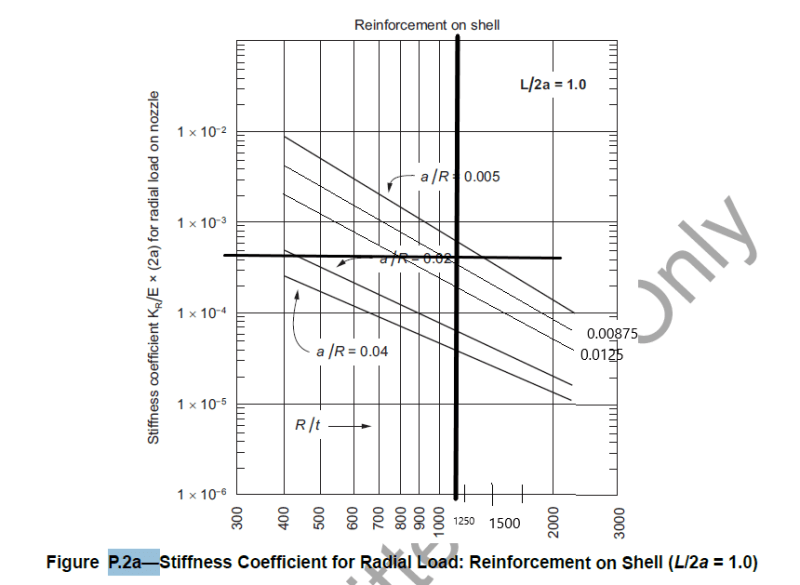
Hi, I am trying to figure out how to extract the data from the P.2a to P.2l graphs. There is an example problem on P.2.9.1 and in the solution it gets a value of 3.1 x 10⁻⁴ for KR/E(2a) on Figure P.2a. I enter that figure and dont understand how to get that value. Is there a tabulated graph or equation to do it?

Thanks in advance for your time.
 
Replies continue below

Recommended for you

No There is no tabulated graph i think. This is a logarithmic scale and you can interpolate between the values graphically. I have used same example values to interpolate graphically.

1_mmziym.png
2_qqojh7.png
 
Thanks for your answer,

The two additional lines you are adding to the graph, how do you interpolate them? Linearly on the graph or do you have to consider it is a logarithmic scale?

I did get the equations for the three original lines from a/R (they are approximate)

a/R = 0.005
KR/(E * 2 * a) = 41285 * (R / t)^-2.566

a/R = 0.02
KR/(E * 2 * a) = 66.762 * (R / t)^-1.975

a/R = 0.04
KR/(E * 2 * a) = 13.971 * (R / t)^-1.823
 
Yes, interpolation should also have been on logarithmic scale. I have mistakenly done linear interpolation in above figure. Using graph it can only be performed through approximation i guess.
 
Status
Not open for further replies.
Back
Top