Continue to Site

Eng-Tips is the largest engineering community on the Internet

Intelligent Work Forums for Engineering Professionals

  • Congratulations The Obturator on being selected by the Eng-Tips community for having the most helpful posts in the forums last week. Way to Go!

Arizona Ground Snow Load Map 1

Status
Not open for further replies.

medeek

Structural
Mar 16, 2013
1,104
Here is my first draft of the (Online) Arizona Ground Snow Load Map:


The interpolation routine may be too simplistic. The data seems to have a lot of sporadic zero snow loads that may make generating isolines somewhat tricky in my opinion.
I am currently only using the three closest stations to interpolate from for a given point of interest, perhaps using more points might be a better method (or worse). I am currently waiting on a response back
from the creators of the Montana Snow Load map to get some guidance and feedback on their method of choice in this regard.

Another interpolation method that may be more accurate is the Kriging method but I am researching that further, for now I have implemented IDW (inverse distance weighting) which seems like a fairly rational approach.

I think it would be useful to take current map I have created and script a program that queries the map on a grid at approximately every 2 miles, from that (30,000 data points) a surface plot of the NGSL data can be constructed and then reviewed for any anomalies. Then if feasible a hard copy map can then be generated with NGSL isolines similar to the Idaho Ground Snow Load map.

There are currently no local exceptions and the weighting and interpolation routine used for each climate zone (entire map) is the same however all of this can easily be customized by zone, elevation, or any other parameter that comes into play. In other words an entirely different interpolation routine could be used for each zone, county, even city or elevation depending on what trends are observed. The IDW interpolation itself can also be adjusted with the "P" factor to give more influence to data points that are closer or farther away to the point of interest. In a nutshell what I have created is simply a rough draft, there is a significant amount of fine tuning and tweaking that can be done and will probably need to be done to make this a usable product.
 
Replies continue below

Recommended for you

Wow! I never realized there was so much variation in snowfall in the State of Arizona. Its 0 psf in Phoenix and 169 psf at North Rim. Sounds like a real nightmare for structural engineers.

BA
 
I just checked my house. It's 0 psf snow load, which might be high.
BA, most of the developed part of the state is low desert and has zero or negligible snow, although there are some mountainous areas that get a lot of snow. For those areas, the local building code prescribes a snow load, sometimes based on elevation.
 
Most if not all of southern Arizona will probably be 0 psf. However, specific areas do have high snow loads, Flagstaff comes to mind.
 
I expect that you would design for a minimum roof live load of 20 psf to take into account occasional foot traffic or sled landings such as the annual Santa Claus visit.

BA
 
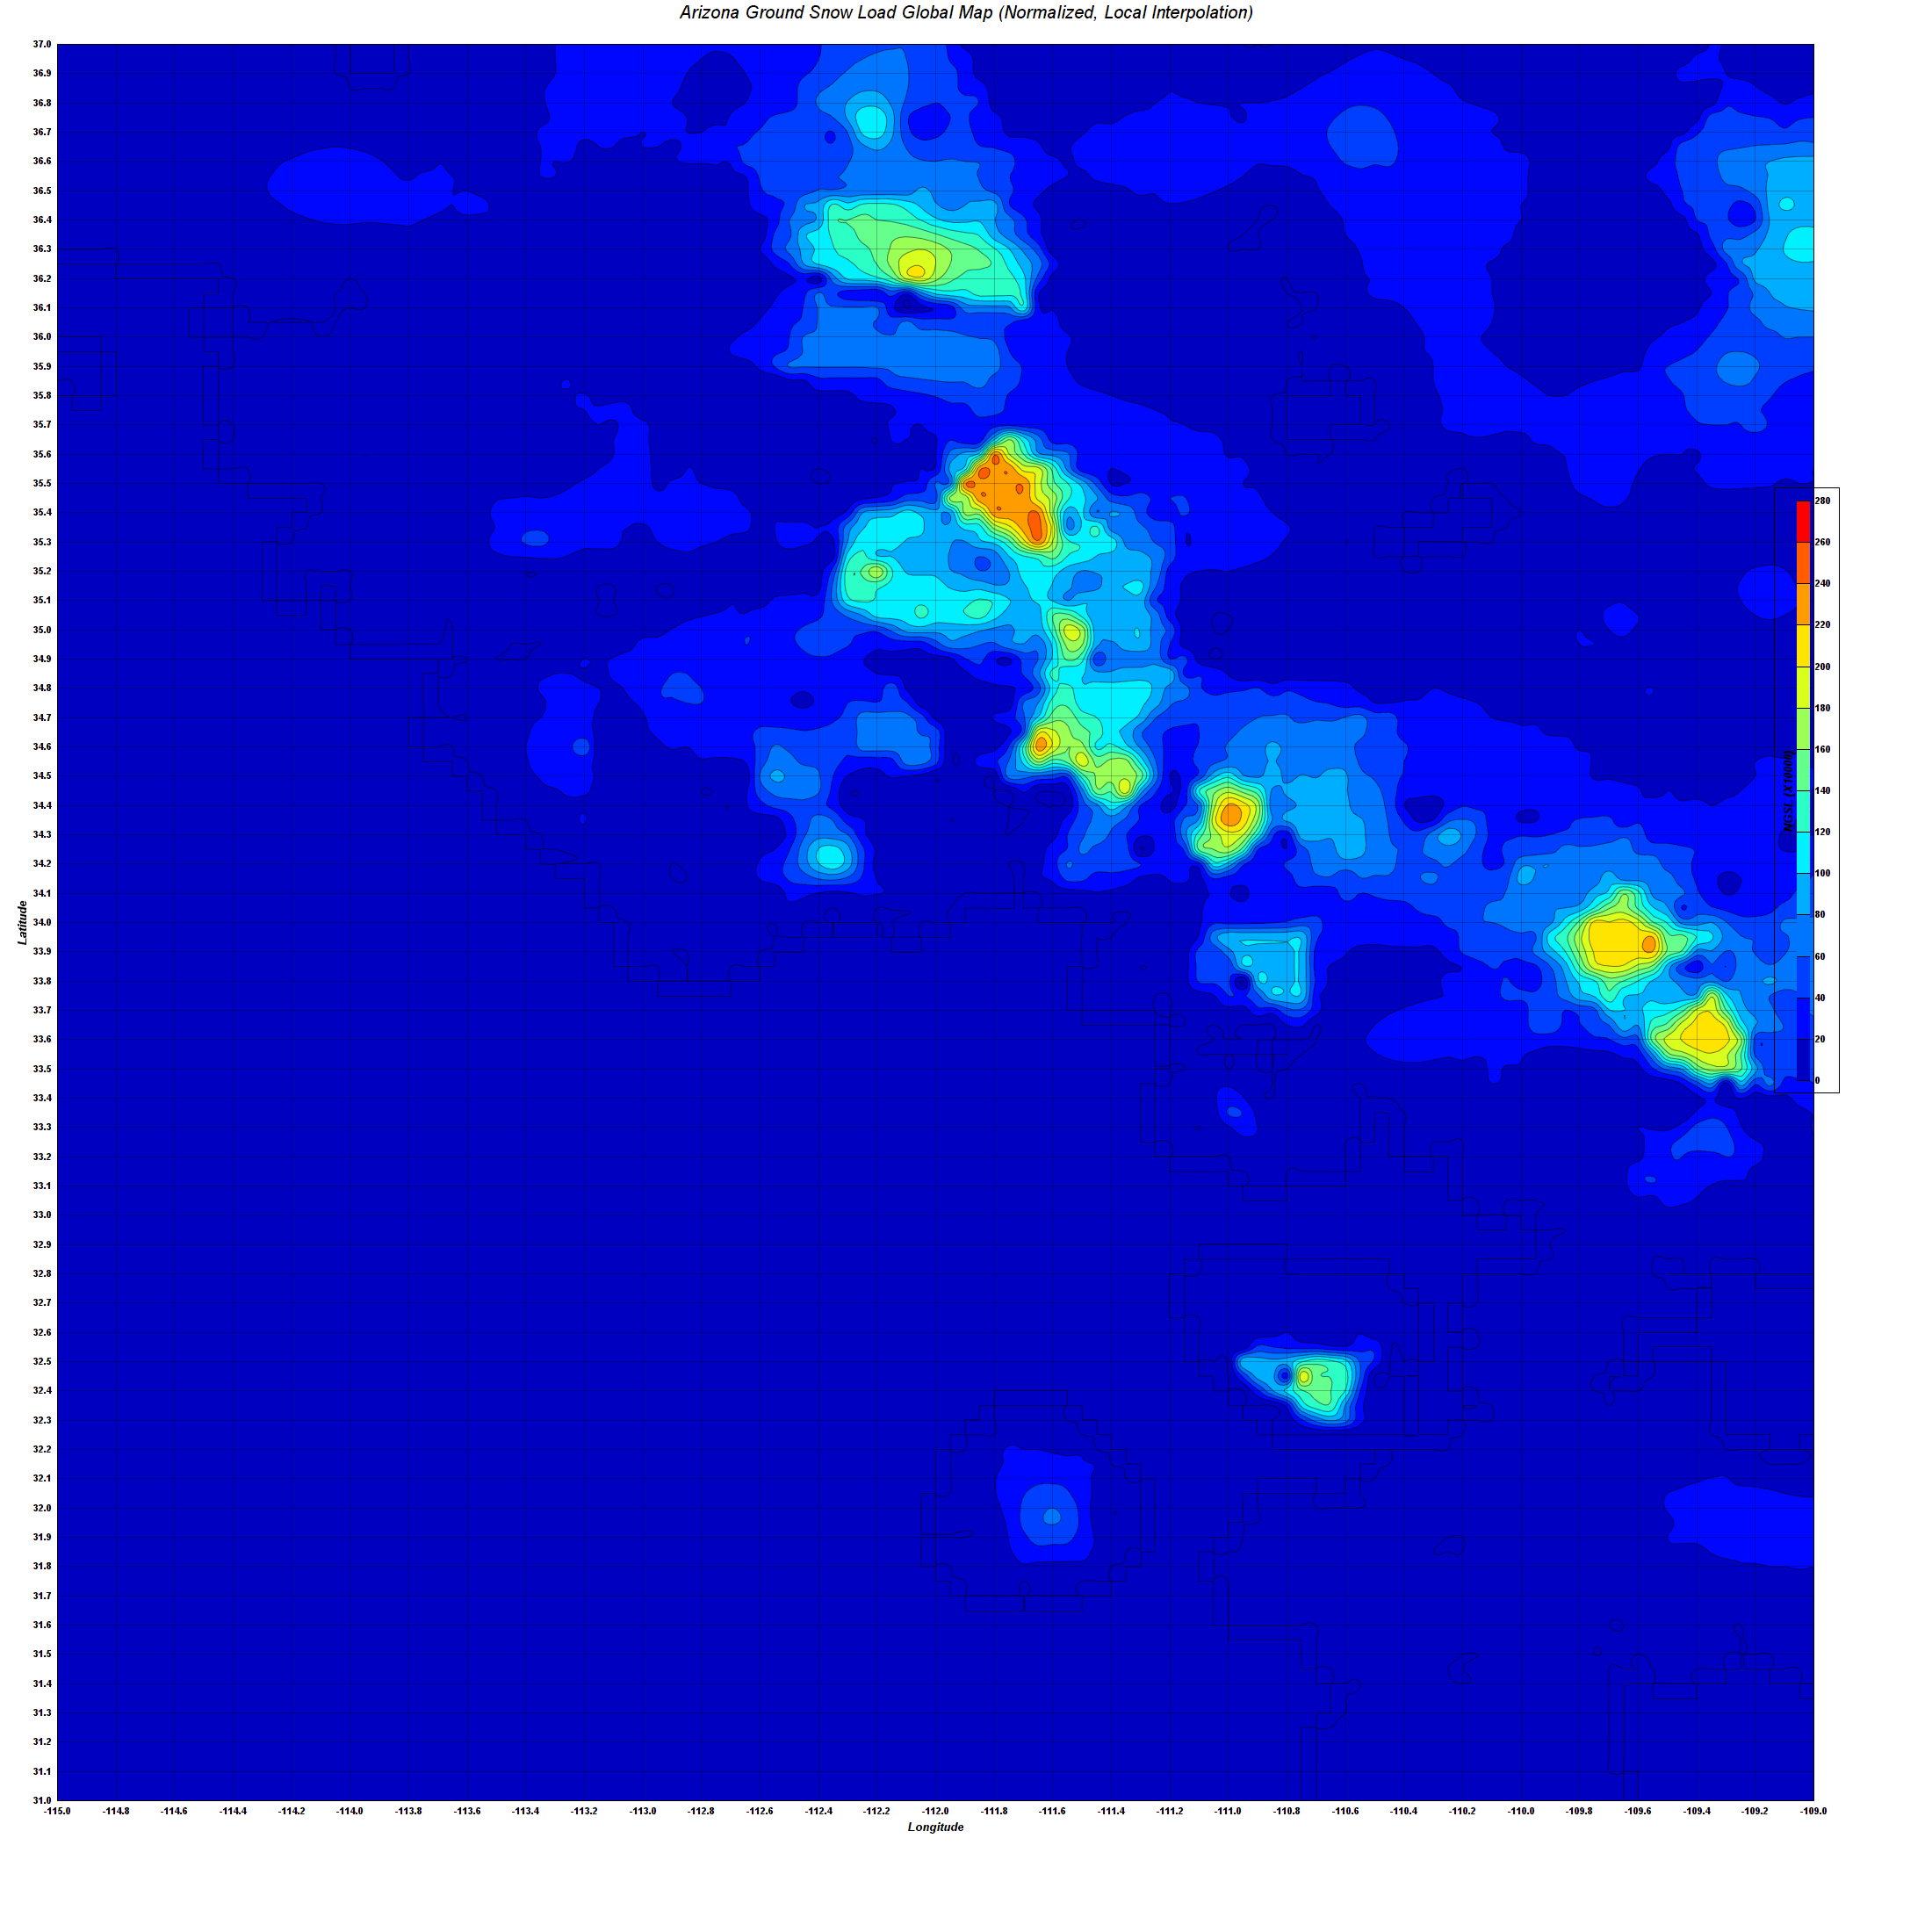
Here are some surface plots of the Normalized Ground Snow Loads using the 3 and 4 point interpolation algorithm of the online map:

ARIZONA_NGSL_09292014.png


The top image is the entire state of Arizona, with interpolated data points every 0.05 degrees (approximately 3.5 miles). The script actually chugged through it even though there were 14,400 data points to calculate. I'm currently using Chartdirector as my surface plotting software. Does anyone have any suggestions on an alternate plotting software. I need something that can handle lots of data points and has a lot of controls for tweaking the cubic spline of the surface plot.
 
couple issues I see. it appears that the app both under and over estimates snow loads and in addition in at least one case reports the incorrect agency having jurisdiction.

Flagstaff city hall
App suggests a ground load of 82 psf and says the AHJ is Coconino county community development. this is incorrect, the city of flagstaff would be the correct AHJ, not the county. in addition, according to Coconino county, the ground load for areas surrounding Flagstaff would be 40 plus an additional 15 for a total of 55 psf. The load reported by your interpolation routine is considerably higher than that.

Showlow
Showlow is underestimated. the application says 27 psf and the code requires at least 40 - 45 psf roof snow load. same with Snowflake which requires 30 - 35 roof snow load but the application only indicates 15 psf.

Safford
underestimated, the app says zero snow load but the code requires 50 psf ground load

Mt Graham, one of the highest mountains - elevation is over 10,000 feet and the app predicts a snow load of just 5.5 psf. your interpolation / data set is inadequate for this area.
 
Like I said the interpolation needs some fine tuning. Probably another months worth of work here at least.

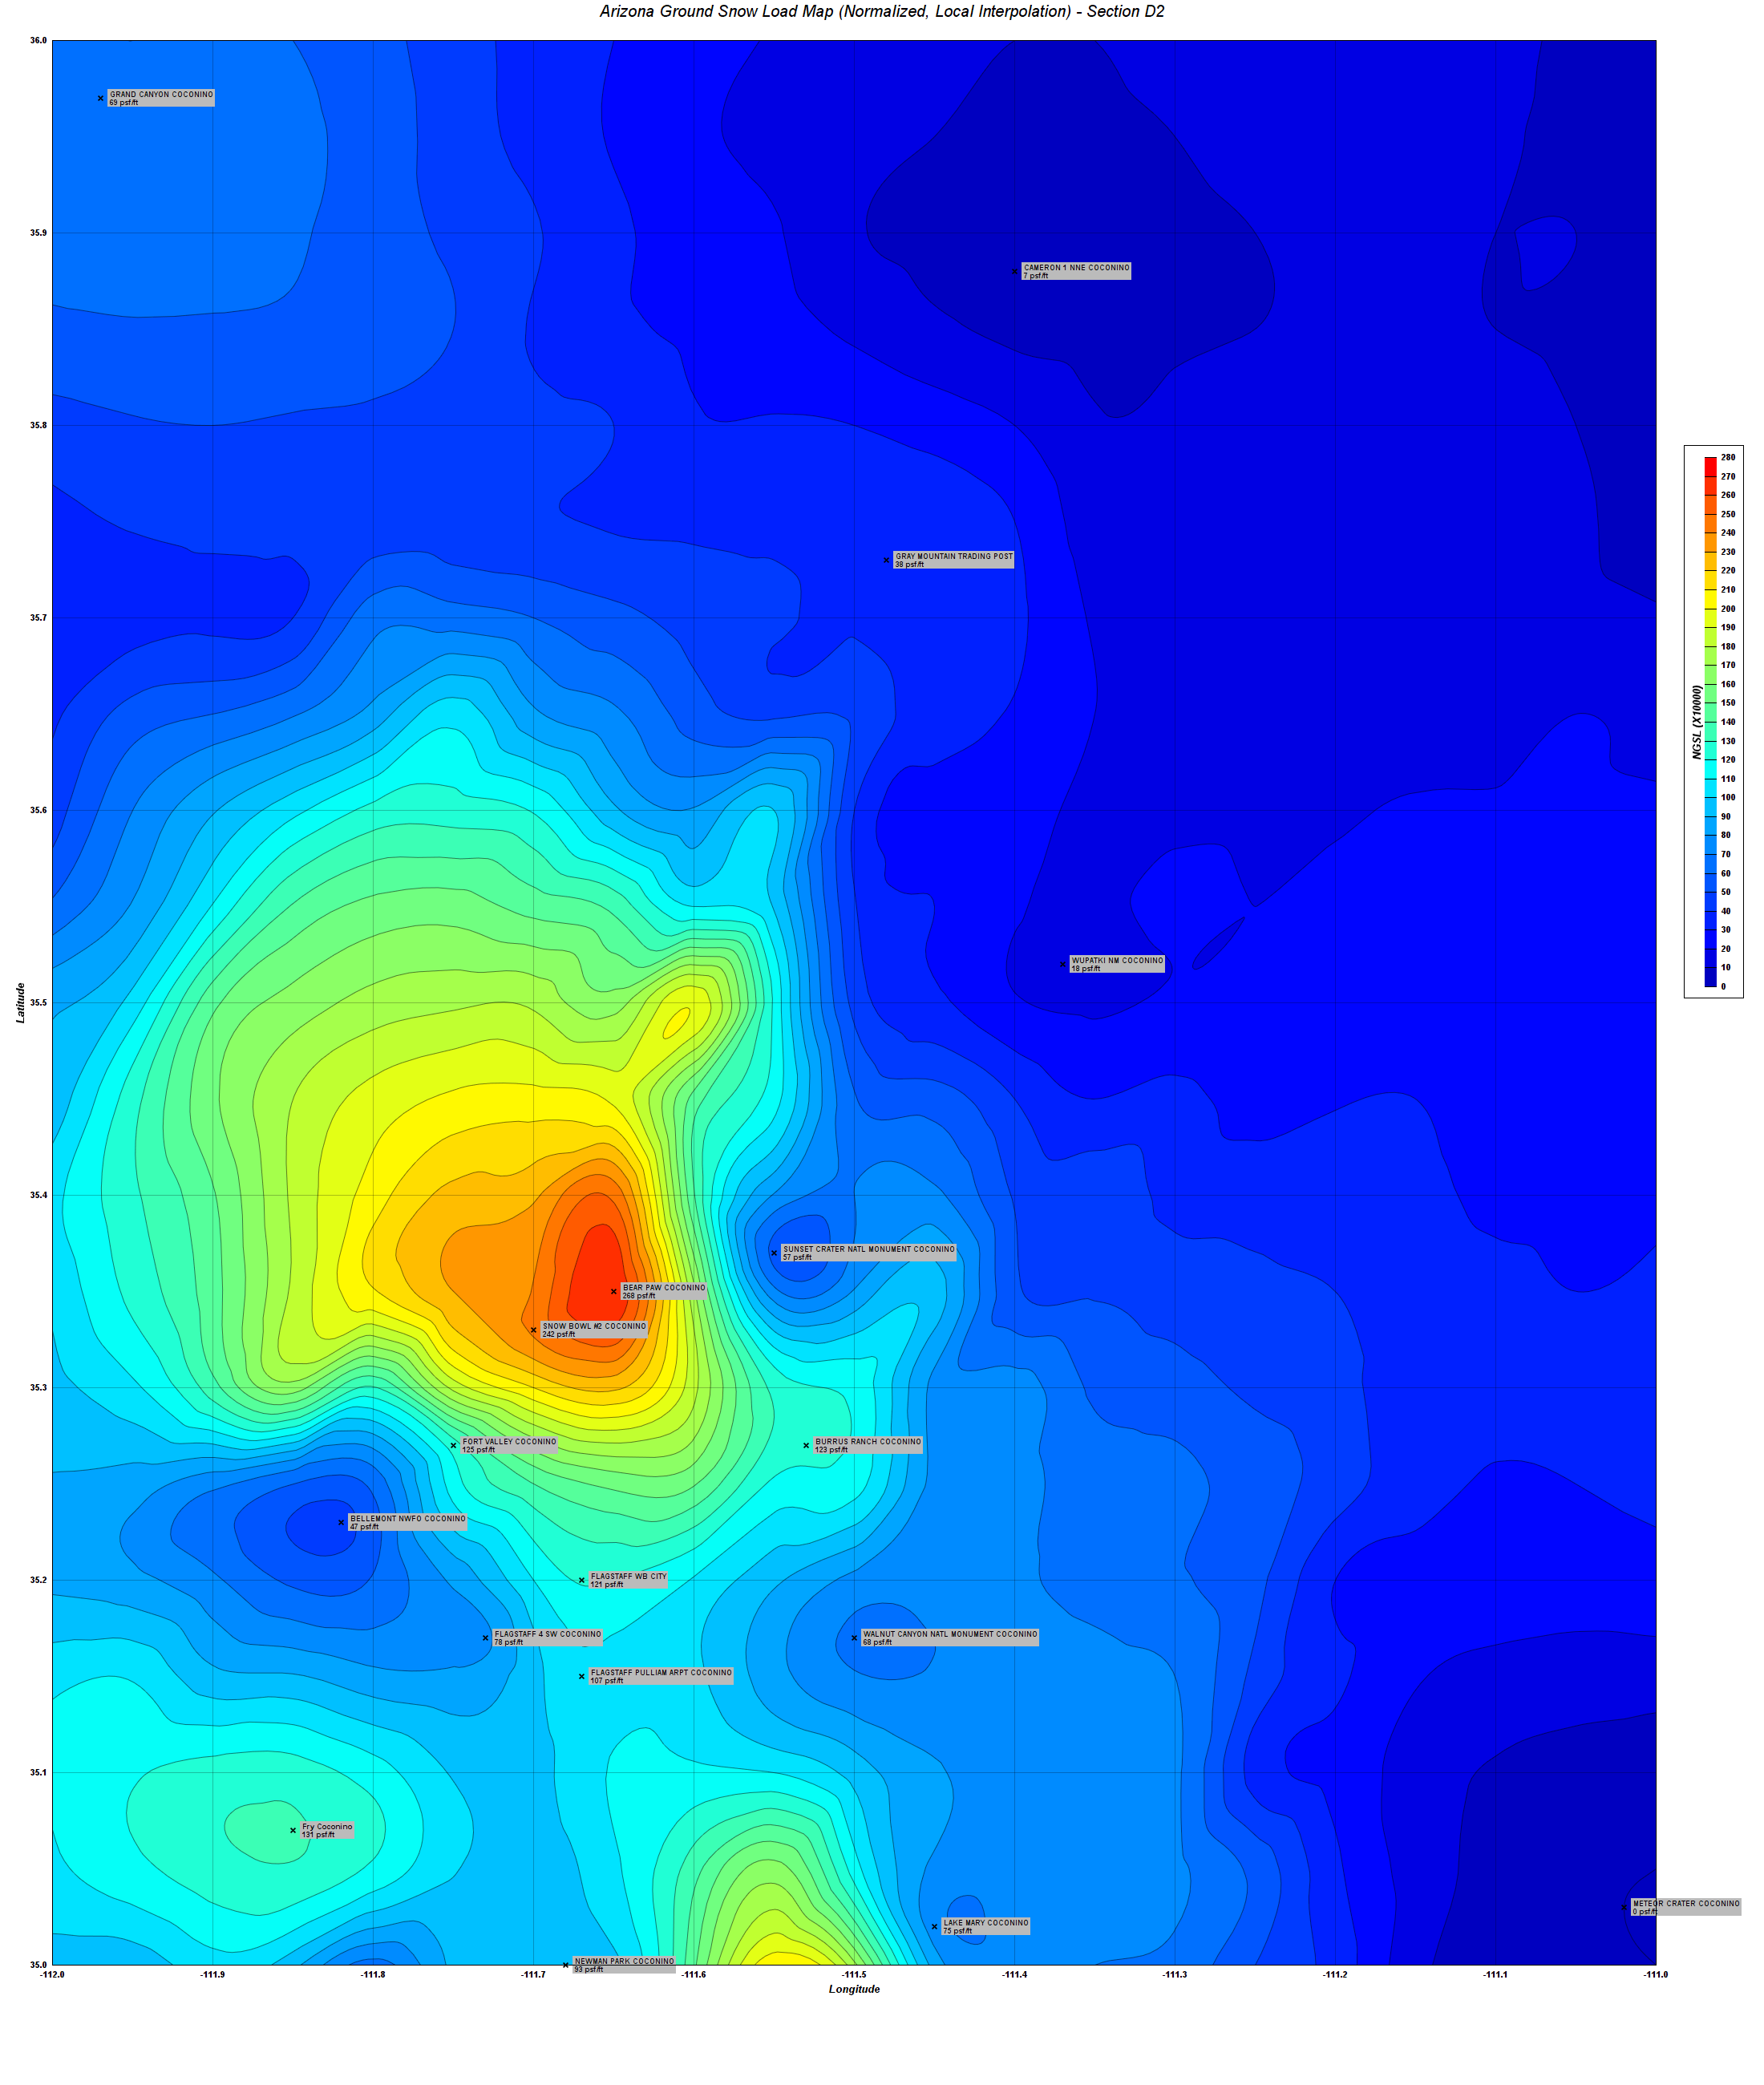
I've now superimposed the actual Climate Stations with their NGSL into the contours maps. I've created 36 blocks since the script takes to long to run reasonably.

Take a look at block D2:

Normalized Map with Data Points

Some weird artifacts going on their North of Bear Paw. At least now with the mapping software in place I can tweak up the interpolation and then easily run a check on what it is doing overall and check for anomalies and areas where it has difficulty or is breaking down.

Note, that the ground snow loads reported will not necessarily coincide with any particular jurisdiction's code that is why I am appending some of this detail below the computed values, for comparison and engineering judgement. Obviously it would be nice if everything matched perfectly but I don't think that will happen, not unless there are some manual exceptions placed into the dataset, which might be the direction to take.

Thank-you for pointing out these issues CVG, they have been duly noted and will help me to further improve the algorithm.

 
Here is an updated map of the entire state showing the climate stations and using a more appropriate aspect ratio for the Latitude and Longitude:

ARIZONA_NGSL_09292014B.png
 
If you look at the following image some interesting things can be observed:

RESOLUTION_COMPARE.png


The first image (left) was at a interpolation spacing of 0.05 deg., the middle image was the same resolution however the actual station data points were included in the surface plot dataset, the third image was at a interpolation spacing of 0.02 deg and station data points were not included in the surface dataset (same as image one).

You will notice that next to the highest peak in this block is a station with a lower value. This seemed to be glossed over in the first image/surface plot. In the second image the nearness of these two points affects the plot quite dramatically. The third image seems to pick it up best and not over exaggerate the difference.

However, the third plot is showing some jaggedness due to the higher resolution of the dataset, the surfacing spline appears to have some trouble here.

The conclusion to be drawn is that where station points are dramatically different in close proximity a higher resolution of sampling is needed otherwise the 0.05 deg resolution appears to be working fine. Also I think it would be useful to include the actual station values in the surface dataset but this may present problems in certain areas.
 
Another interesting comparison:

INTERP_POINTS_COMPARE.jpg


From left to right: 10 point interpolation, 6 point interpolation, 3/4 point interpolation.

As expected the more data points used in the interpolation the more averaged out the result. I've determined that the inverse squared IDW method seems to give me the best result so all three of these methods use that algorithm.

The next thing to possibly consider is selecting the data points not based on distance from the point of interest only but also considering the concept of how these points surround the point of interest (Delaunay Triangulation). If we consider three point interpolation (three nearest neighbors) then the point should fall within the triangle formed by these points and also we should select that triangle of points such that they are "well formed".

Possibly even the average of the 6 point IDW interpolation with a three point Delaunay Triangle IDW interpolation, with the ability to weight the average one way or other based on some sort of criteria.
 
I have now implemented Delaunay Triangulation which seems to help fix some of the problems with the previous map and algorithm. I'm too tired to write much more but fortunately their was a perl module that handled the triangulation and that saved me a lot of time.
 
Cvg I haven't had a chance to look at all of the issues you brought up but I did take a quick look at Safford.

1.) Station 2:

Name: SAFFORD AGRI CENTER GRAHAM
Zone: 7
Latitude: 32.82
Longitude: -109.68
Elevation.: 2953 ft.
Max. Snow Depth: 14 in.
Max. SWE: -- (in. of H2O)
Years of Data: 57
Pg: 1 psf (30-yr, Eqn. 3.12)
Pg: 2 psf (50-yr, Eqn. 3.12)
Distance: 2.00 miles
NGSL: 0.00068 psf/ft


3.) Station 1:

Name: SAFFORD GRAHAM
Zone: 7
Latitude: 32.83
Longitude: -109.72
Elevation: 2903 ft.
Max. Snow Depth: -- in.
Max. SWE: -- (in. of H2O)
Years of Data: 50
Pg: 0 psf (30-yr, Eqn. 3.12)
Pg: 0 psf (50-yr, Eqn. 3.12)
Distance: 0.46 miles
NGSL: 0.00000 psf/ft

The two stations that are basically located right in Stafford show a snow load of 0 psf with 50+ years of data. I'm not sure why Stafford requires a 50 psf snow load, how did they arrive at this number?
 
CVG go ahead and try Flagstaff again. You will notice that the app now brings up both the county and city design criteria (mostly for comparison sake and quick reference). Unfortunately, I'm not able to determine exactly which jurisdiction will be the AHJ on some exact locations therefore the disclaimer to verify the AHJ with local building departments.

With google maps (reverse geolocation) I can fairly accurately determine if a location falls within a city boundary however it is not 100% exact.

With county boundaries I am using KML files so I have a much more exact answer at that level.

I could possibly generate a KML polyline (boundary) for each city of interest and then use one of my previous algorithms to check whether the point of interest is within the polygon, I've been down that road before (Utah Snow Load Map). However in the interest of time I will not pursue that course of action right now.

With regards to the actual snow loads, based on the SNOTEL sites and other data from the recent study and also in light of certain recent events with roof collapses due to large snow falls, I would say that I would definitely err on the conservative side here. In my opinion the county and city governments have it wrong and would be well advised to update their minimum design criteria for the snow loads for Flagstaff.
 
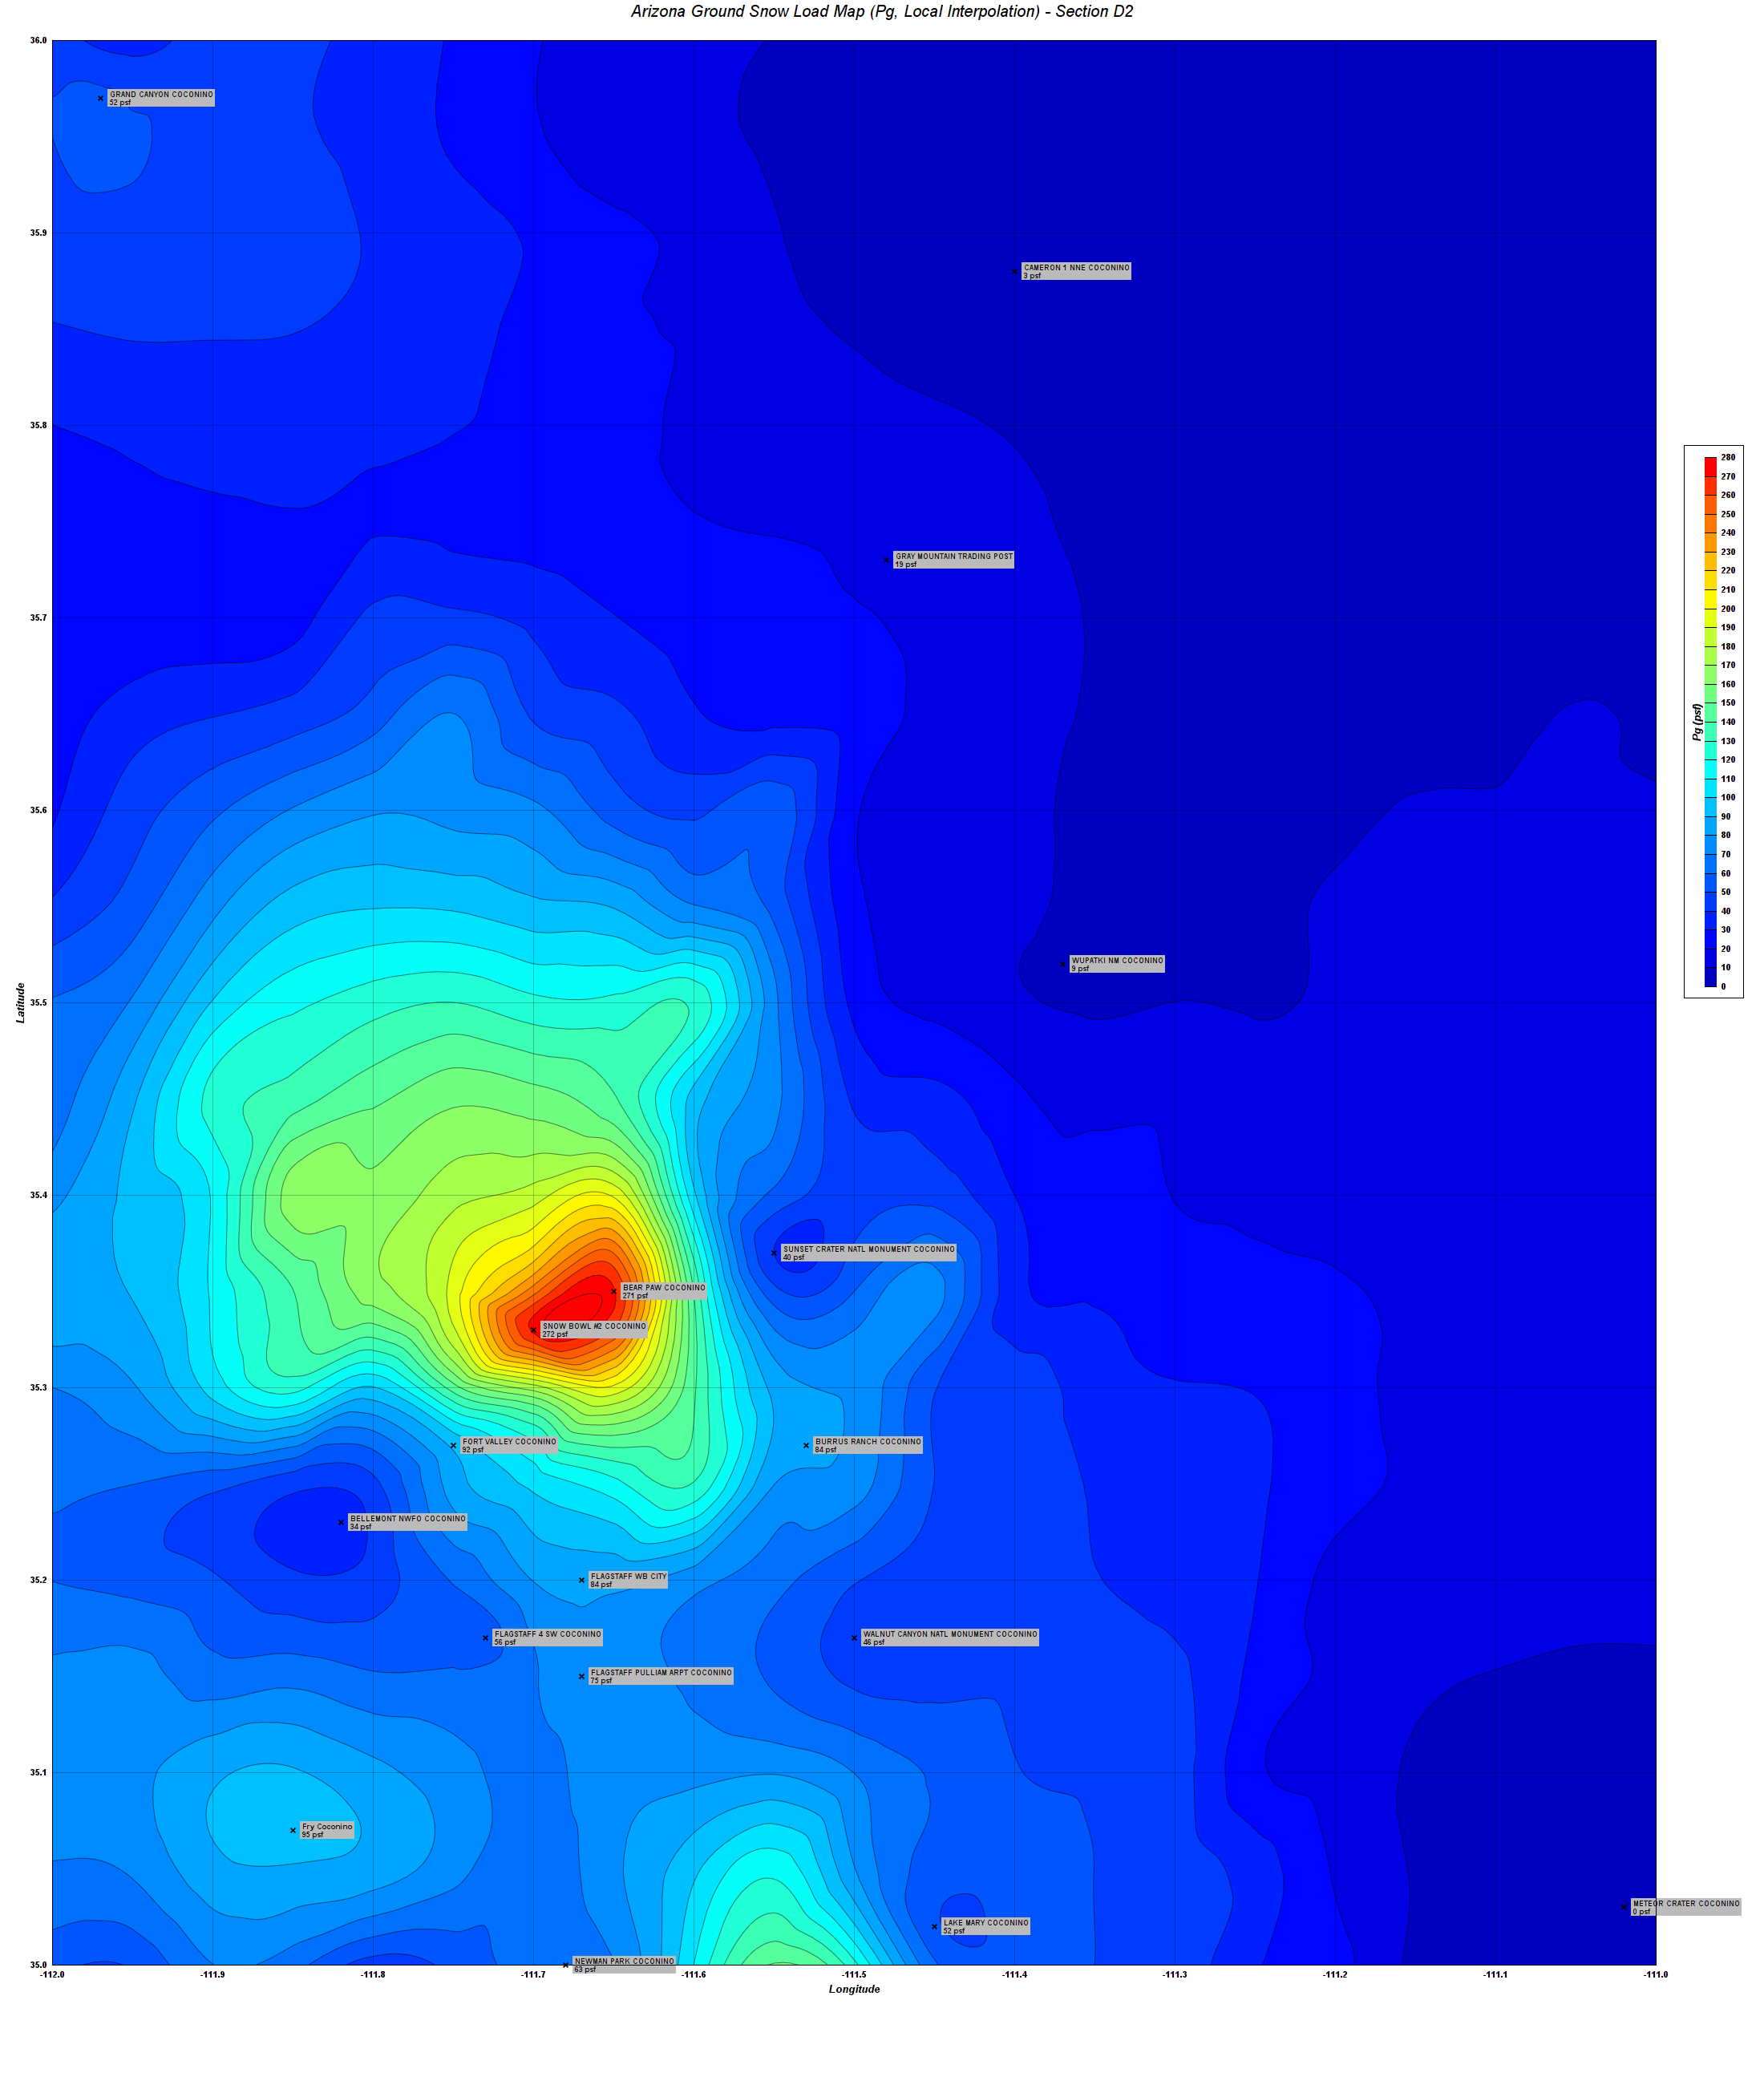
The NGSL map and the Pg map are fairly similar as can be seen from a block of the map below:

D2.png
D2PG.png


What this tells me is that the relationship between snow load and elevation is not linear and a truly normalized snow load would probably need to involve a power function of the elevation or some other non-linear relationship.
 
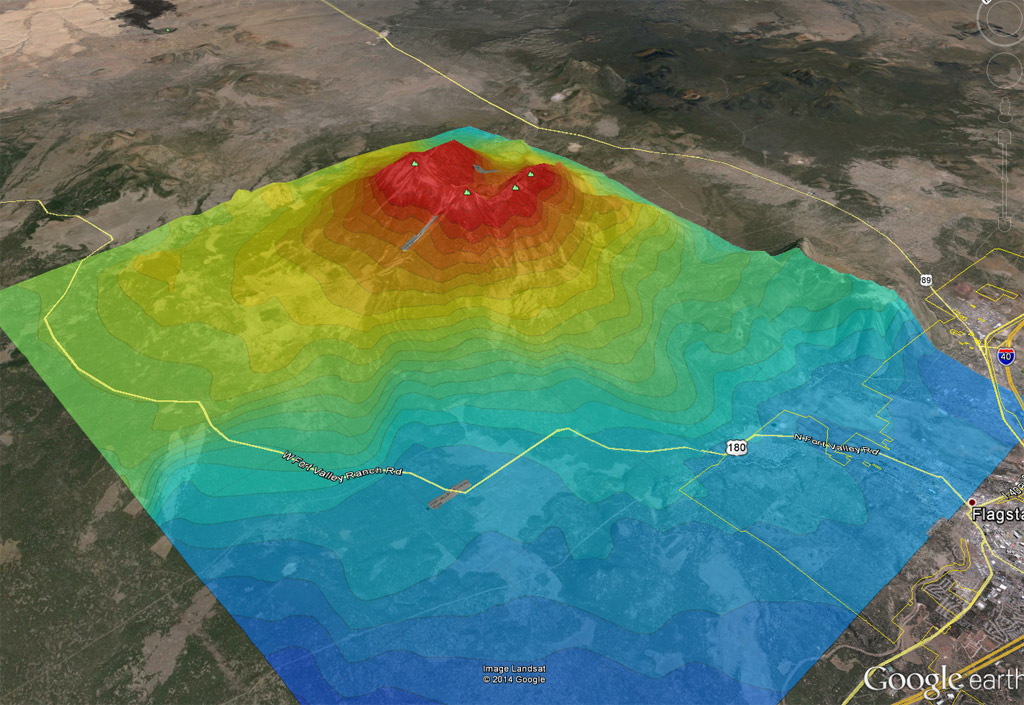
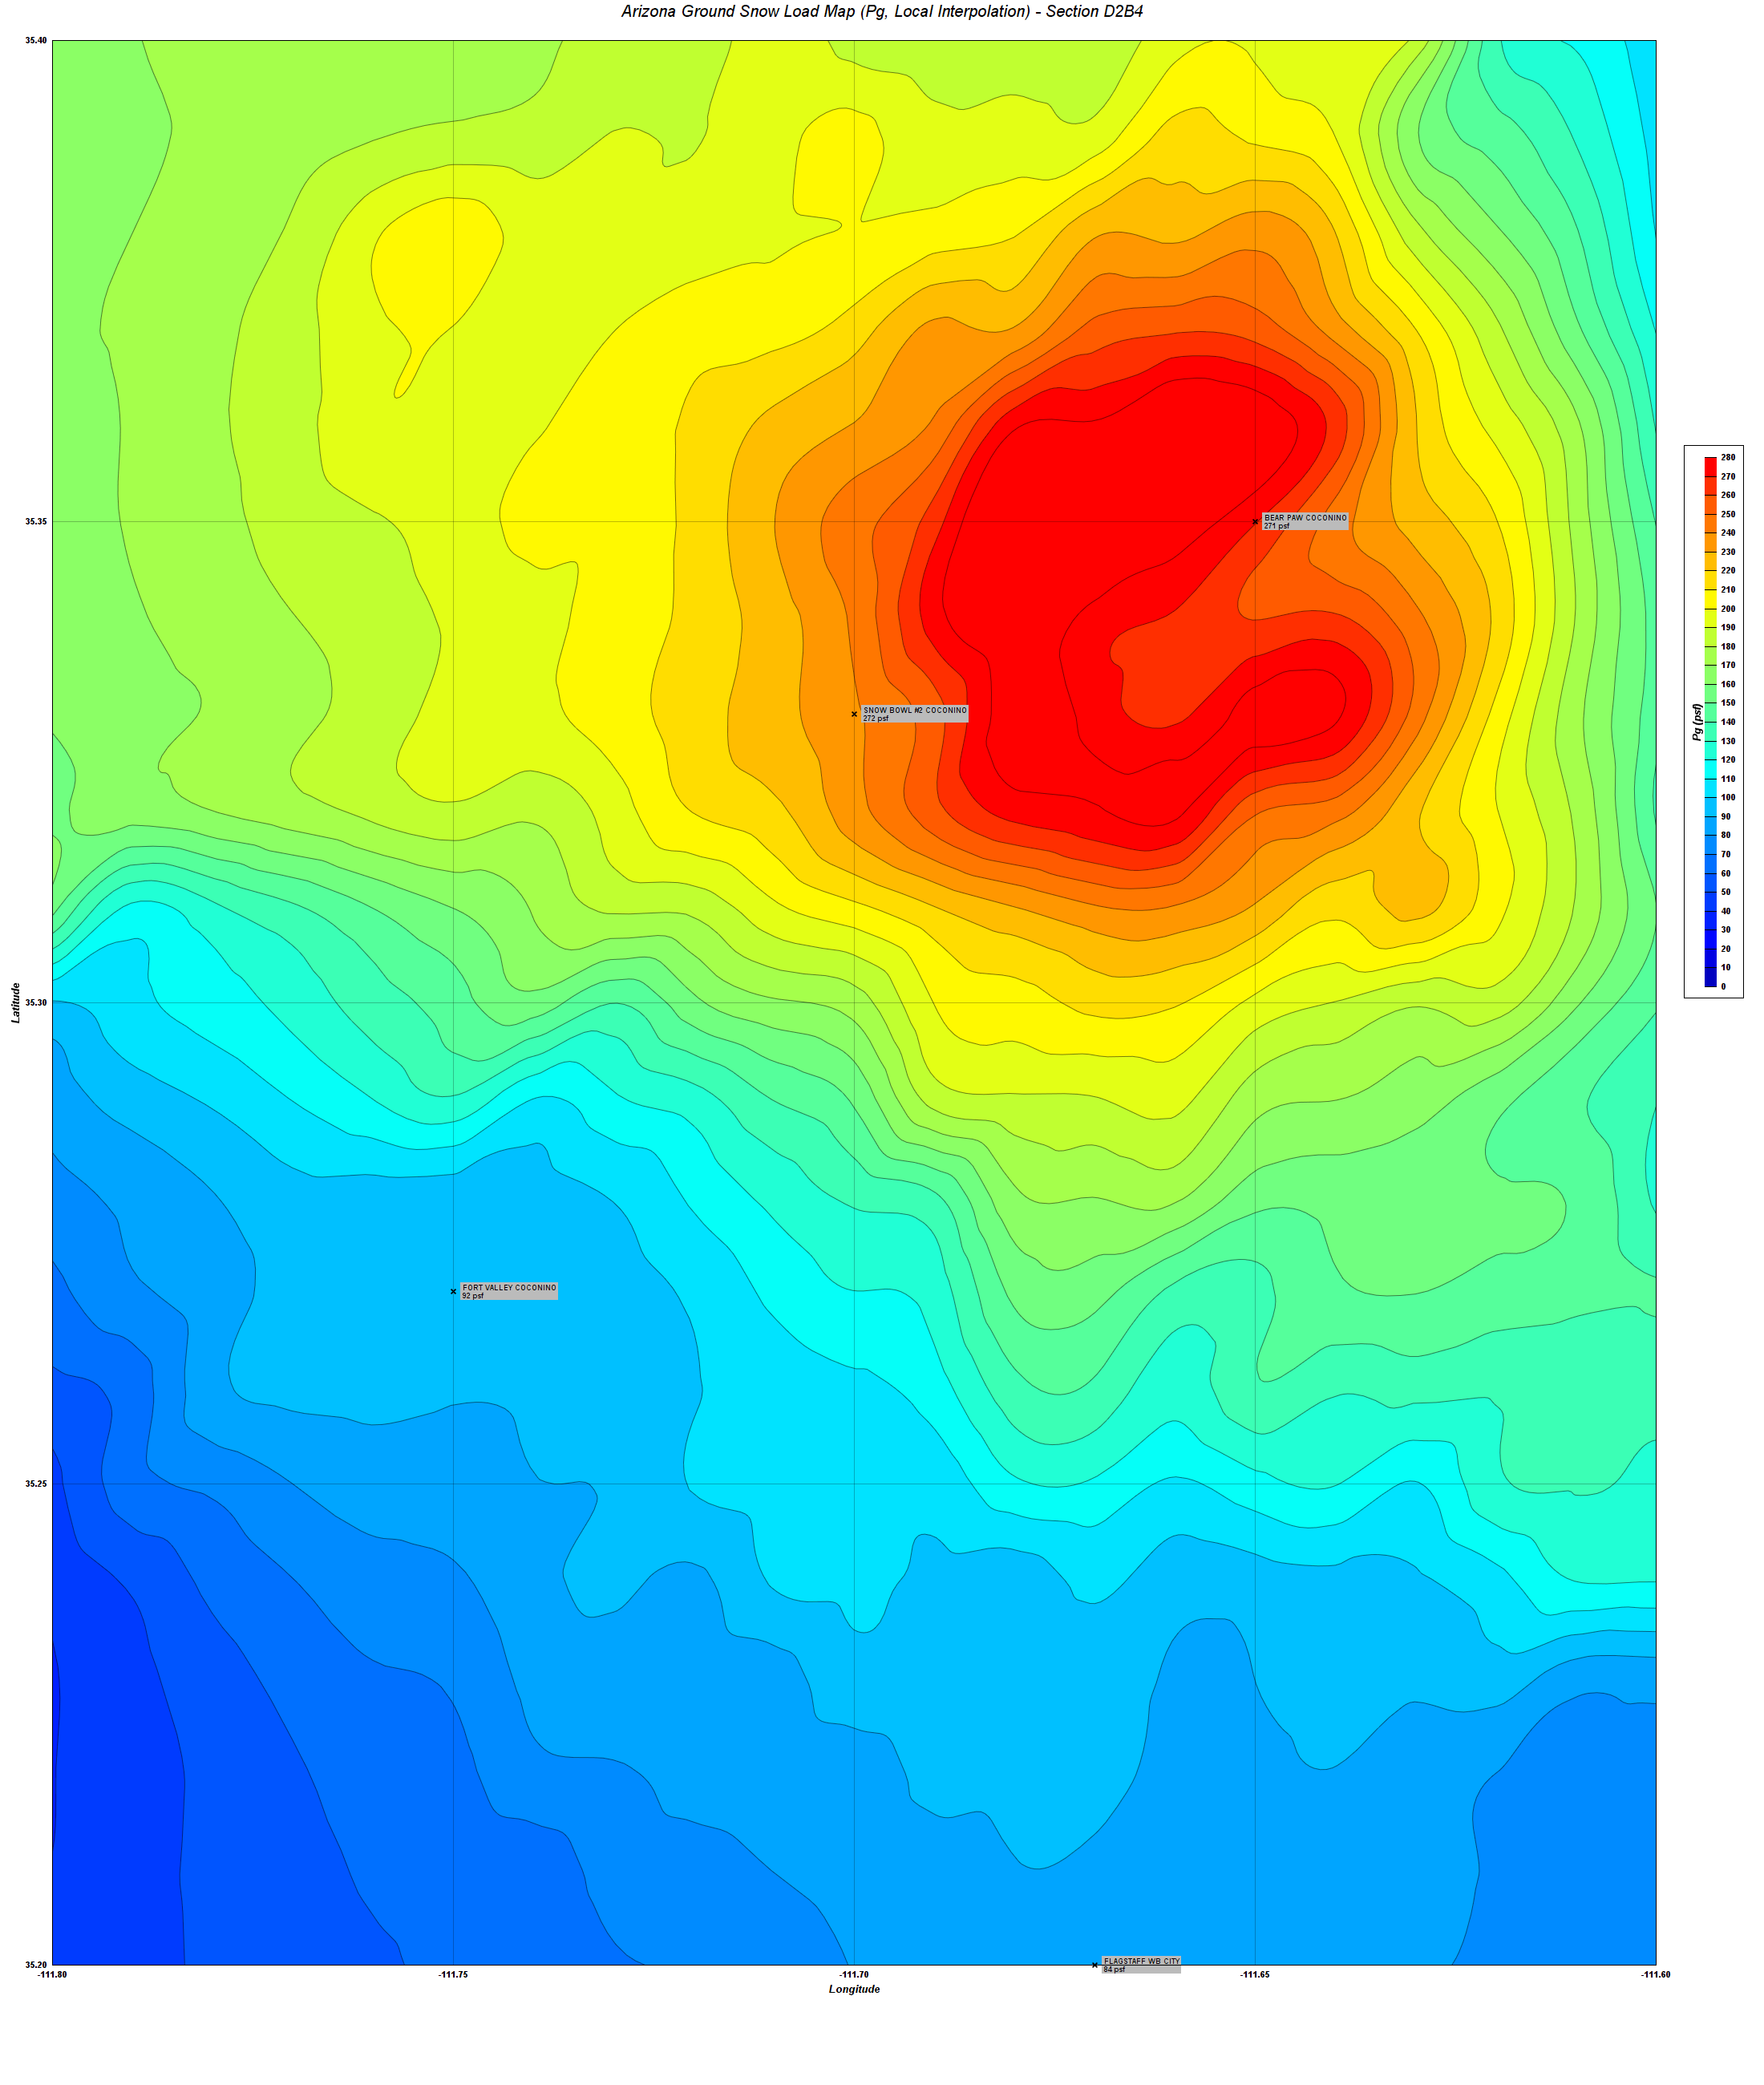
The image below shows the Ground Snow Load (Pg) overlayed onto Humphries Peak just north of Flagstaff.

The contour map is shown below:

GE_D2B4_OVERLAY.jpg


D2B4PG.png


The snow load is pretty much as expected however the small mountains at the north border of Flagstaff do not seem to as high as a snow load as I would expect. What this tells me is that where there is high elevation and no monitoring station the Normalized ground snow load will probably be underestimated. What it really boils down to is that without a lot of data points this method of interpolating (IDW) is not granular enough to account for mountainous terrain especially when the NGSL is obviously being influenced by elevation.

At this point my thinking is that the interpolated data from the snow stations is good but that should also be compared or averaged with a snow load value based purely on elevation and maybe some other general climatic criteria. I've been looking at the Utah snow load equation for exactly that reason. Even though the data from Freestone's study does have a lot of scatter there is still a discernible relationship between elevation and snow load. This will require further thought and investigation.

2006 Snow Load Study, Scott Freestone
 
Another interesting thing I noticed when looking at the overlay is that the Station on the west side of the peak is listed as Pg = 272 psf, about the same as the eastern snow station. You'll notice that the isolines show its location at about 239 psf. At first the discrepancy had be boggled but then I looked at the station data and compared it with the actual elevation data from google earth. The lat and long that places this station into the map is not granular enough, only to the second decimal place, hence it actually is placed slightly down the slope from where it actually should be. The really cool thing is that the interpolation routine automatically deals with this and the isolines are not terribly affected.

However it does make me question the lat and long values for each station and even the elevation data, all of which will now need to be checked.
 
be careful with using Utah as a model for snow loads since snow in Utah is heavily influenced by the lake. I agree that you lack data where you need it most and that the elevation is a critical parameter in estimating snow
 
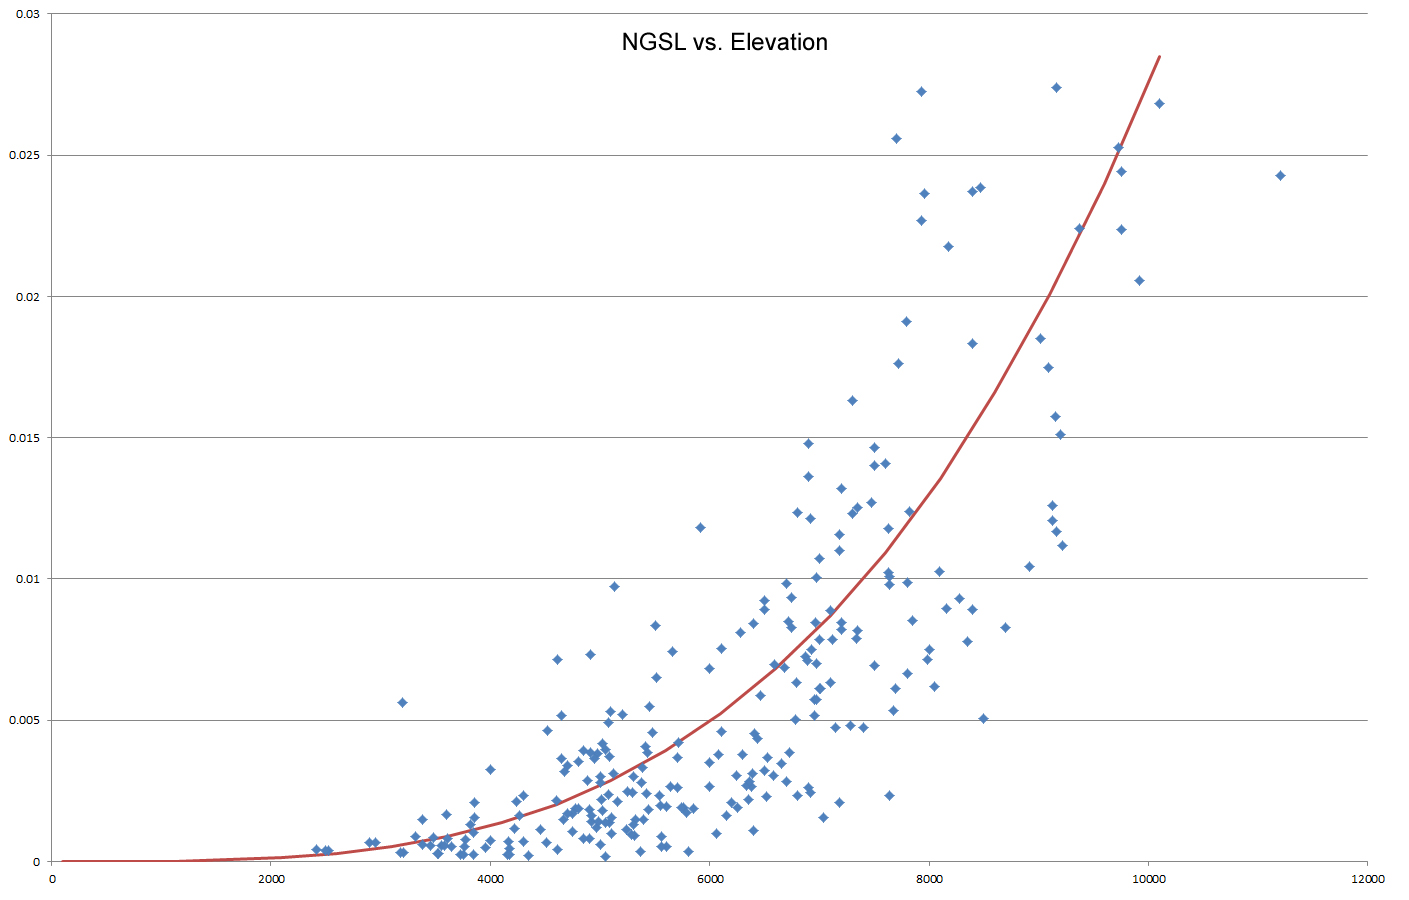
Here is a graph of the NGSL vs. elevation for each non-zero station. There is a lot of scatter in the data however I think I see a general trend which I have tried to capture.

NGSL_ELEVATION.jpg


I've inserted and additional piece of logic into the interpolation routine which checks the distance to the nearest station, if it is above some threshold (20 miles) then the interpolated NGSL is averaged (IDW) with an NGSL that is based off of the power function given above. It would probably be more accurate to use a regression curve specific to each climate zone however the number of data points is not sufficient in my opinion to achieve this. Furthermore when the NGSL or Pg values are plotted against elevation for each climate zone the scatter in the data does not significantly approve.

I'm not entirely sure what to set the max distance at but 20 miles seemed a good place to start as any. Most points within the state fall within 30 miles of a station so 20 miles is about as high of a max distance that will still influence the final determination of the snow load.
 
Status
Not open for further replies.

Part and Inventory Search

Sponsor