Eng-Tips is the largest engineering community on the Internet

Intelligent Work Forums for Engineering Professionals

Composite Pump Curve for Dissimilar Pumps in Series 2

Status
Not open for further replies.

paracetamol

Mechanical
May 15, 2024
5
0
0
AE
Hello all,

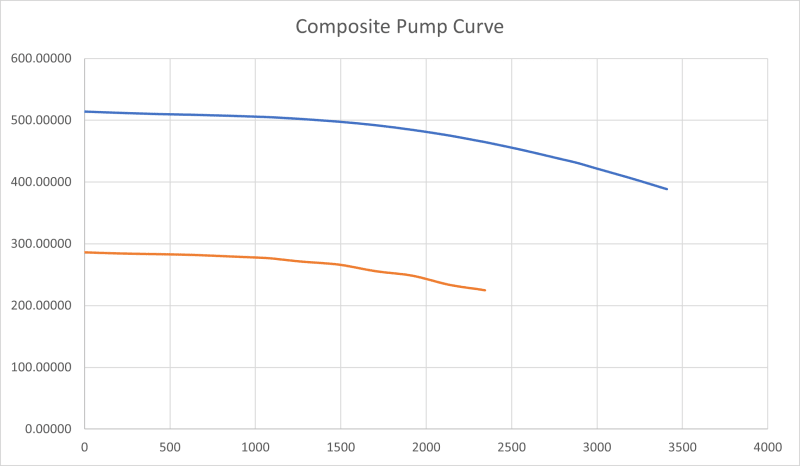
I have two dissimilar pumps in series.

To plot the composite pump curve, is it okay to assume that Flow_both = (Flow1 + Flow2)/2 and Head = Head1 + Head2?

First pump is fixed speed and the second is variable speed.

Just trying to find the approx. intersection with the system curve to know what speed the second pump will have to be set to.

Approx. values are okay because this is just for a power consumption estimation. But will I be too far off?

Thank you sm
 
Replies continue below

Recommended for you

In series, the flow is the same in both pumps..... so Flow 1 = Flow 2. (Conservations of mass etc)

Then add the differential head at the SAME flowrate. you cannot have two different flow rates so (a+a)/2 = a....

So e.g. pump 1 at 10m3/hr has an outlet head of 50m. [All numbers just for illustration as you've not given any]

If the second is variable speed then you will end up with different heads to add on top of pump 1, but the speed needs to be high enough that it can handle 10m3/hr.

So total had is 50 + whatever the VFD unit is doing for you at a flow of 10m3/hr.

Does that make sense?

Remember - More details = better answers
Also: If you get a response it's polite to respond to it.
 
I'm thinking that the vfd pump may tend to set either the system flow rate, or its discharge head, or both, depending on its control signal and resultant rpm, thereby affecting the flow and discharge head of the constant speed pump. How the vfd is controlled will decide how the two behave as a group. Loose control response may cause some oscillation.

--Einstein gave the same test to students every year. When asked why he would do something like that, "Because the answers had changed."
 
See attached.

I've just added the base fixed pump rate to the nearest flow in your reduced set of data to create a reduced curve.

Just put this (a + b)/2 thing out of your head for flow. Please.

Picture10_zmksza.png


Remember - More details = better answers
Also: If you get a response it's polite to respond to it.
 
"To plot the composite pump curve, is it okay to assume that Flow_both = (Flow1 + Flow2)/2 "

Think about the question. The pumps are in SERIES. So, if 100 m^3/h comes out of the first pump, where does it go? It has to go to the second pump. The second pump does not manufacture liquid, so it cannot be pumping more than is coming in to it. Nor can it pump less, unless there is some other place in between the two pumps that the liquid can go to, or come from.

 
Status
Not open for further replies.
Back
Top