Continue to Site

Eng-Tips is the largest engineering community on the Internet

Intelligent Work Forums for Engineering Professionals

  • Congratulations waross on being selected by the Eng-Tips community for having the most helpful posts in the forums last week. Way to Go!

Compressor MAP Ideality

Status
Not open for further replies.

kilrbee

Chemical
Sep 2, 2006
41
Referencing a typical centrifugal compressor used in an automobile turbo application:

1. What atmospheric conditions is the MAP based based on? Standard Day?

2. What would be the effect on the map with a departure from this temperature, eg 160 *F (620 *R) CIT? Does the whole map translate to the left? Down?

 
Replies continue below

Recommended for you

There I go again. I mean map (small letters)

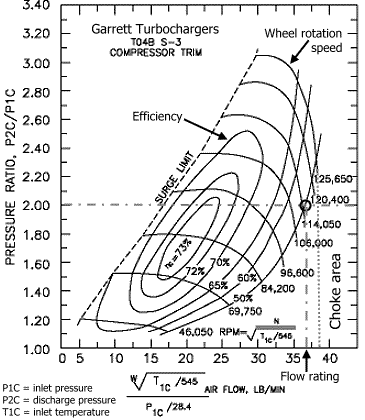
The y axis is pressure ratio, the x-axis is normally air mass flow rate.
 
Notice that the x-axis is a corrected mass flow rate based on the inlet temperature and pressure and that the standard conditions are built into that formula. Does that answer your question?

I2I
 
No.


I don't see where inlet temperature is mentioned to produce the map, or mass flow x axis.

I assumed the map is under standard atm conditions, sea level and 77F. I also believe the whole map moves to the left on the x-axis, using the ratio of absolute temperatures. EG, 160 F=620 R

537/620=87%. So a given point plotted on the map would realize 87% of mass air flow if the CIT is 160 F, vs 77.

Effectively shifting the map to the left.

I just want corroberation that I am on the right track.
 
flowmapparts.gif


The equation for the corrected mass flow rate is labeled on the x-axis. The standard conditions are built into that equations. The standard conditions are the denominators of the temperature and pressure correction terms. In this case, the standard temperature they are using is 545[°]R and standard pressure is 28.4 inHG. Commonly, I've seen these mass flow rates converted to volumetric flow rates so that it can be used without respect to standard conditions. All you need to do to use this map is plug the actual inlet temperature and pressure into the equation and read the correct numbers.

I2I
 
Thank you for the explanation on the atm standard. I slapped my head.

In my case, I am reading mass flow from a MAF sensor, then using the chart to determine efficiency.

I need to understand if/how the efficiency decreases as inlet temp goes up above the 85 they use for standard.
 
Darn

so far, there is not a definitive answer on whether increasing inlet temperature, decreases adiabatic compressor efficiency.

Anyone?
 

There isn’t one. The adiabatic efficiency depends on where on the map you are operating. For example, if the operating point moves from the current position to the left on the characteristic at a constant pressure ratio the adiabatic efficiency will increase (i.e. a decrease in corrected flow). Similarly, for a given corrected flow the decrease in pressure ratio will decrease the adiabatic efficiency. Please note that the operating point on the compressor map depends on the system resistance.

Compressor (and turbine) maps plotted on non-dimensional basis, which can then be based on corrected mass flow as shown here, are independent of inlet pressure, temperature and flow provided the flow is turbulent, which is normally the case. Therefore the map doesn’t change with change in inlet pressures and temperatures. These issues are briefly discussed in thread71-148875. As stated in thread71-148875 it is useful to include the gas properties term R (gas constant) and Gamma (ratio of specific heats).

I trust this helps.

Regards
 
Status
Not open for further replies.

Part and Inventory Search

Sponsor