Continue to Site

Eng-Tips is the largest engineering community on the Internet

Intelligent Work Forums for Engineering Professionals

  • Congratulations pierreick on being selected by the Eng-Tips community for having the most helpful posts in the forums last week. Way to Go!

criconden?

Status
Not open for further replies.

MortenA

Chemical
Aug 20, 2001
2,998
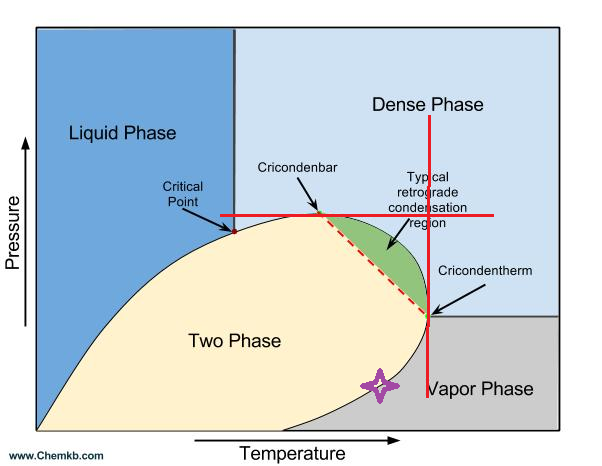
You get cricondenbar for pressure, cricondentherm for temperature, but what if its a PH diagram - then its a criconden???
 
Replies continue below

Recommended for you

Not sure what is the question - are you looking for identification of Cricondenbar and Cricondentherm points on a PH diagram, or looking for "cricondenthalpy" term, following analogy with pressure and temperature?

The enthalpy of fluid at Cricondenbar and Cricondentherm is determined by the actual temperature at the Cricondenbar pressure, and by the actual pressure at the Cricondentherm temperature. There is infinite number of temperatures at the Cricondenbar pressure, and infinite number of pressures at the Cricondenbar temperature (red lines on the chart below). And there is only one two-phase temperature at the Cricondenbar pressure (called Cricondenbar temperature), and only one two-phase pressure at the Cricondentherm temperature (called Cricondentherm pressure). Enthalpies at these two states are determined by known pressure and temperature.

Does it make sense or have I made it more confusing?

envelope_ouh2vp.png


Dejan IVANOVIC
Process Engineer, MSChE
 
@Dejan. not confusing, just evident that i didnt explain myself properly. I knew what you said, i aske for the thrid type of diagrams with a BUBLP and DEWP curve, a PH (or TH) diagram)

See attached graphics

So in this diagram on the dew point line what is the point called (if it has a name) where on the right side only vapour phase can exists?
 
 http://files.engineering.com/getfile.aspx?folder=43b294e5-a6d5-496b-8c0d-59c81ded29df&file=cricondenwhat.JPG
It represents one of the dew points on the dew point curve, which would correspond to any of the points below the Cricondentherm point and along the dew point line on the chart in my first post.

Cricondentherm on P-H diagram can be identified by plotting constant temperature lines and locating the point where the highest temperature line intersects (tangents) the 2-phase line. I believe the point you mentioned is just a dew point at given pressure, and it is below the Cricondentherm temperature - but only by plotting the constant temperature lines we can confirm that.

Dejan IVANOVIC
Process Engineer, MSChE
 
I dont get that Dejan, are you saying that the curve marked at "dew point" is _not_ a true dew point curve? I would think that it was- the point where at a given pressure at that enthalpy (considering the reference) you get condensation? (in the figure i attached i included 3 isotherms - but thats just because i was lazy and didnt remove them they have no relation to my question. Does the point on the dew point (the blue curve) curve at a pressure of approximately 18 barg have a name?
 
It is dew point of this mixture at XYZ pressure (whatever the value of pressure is at this point). I believe the Cricondentherm point is somewhere upper on your chart, along the blue line, and in any case where the highest temperature isotherm intersects the blue line.

I think the point you indicated on your chart is somewhere in the area where I plotted a purple star (or Ninja's shuriken) on the chart below.
Perhaps by identifying the Cricondentherm pressure on P-T diagram (line of P=constant to the Cricondentherm point) and then plotting the same P=constant line on P-H diagram can show you where is Cricondentherm on P-H diagram. All other points on the dew point line are just dew points at various pressures, and I think they don't have any specific title.

envelope_ouh2vp_j2huuv.png


Dejan IVANOVIC
Process Engineer, MSChE
 
OK i got the part about going from the HX diagram to the PT diagram, and i just was wondering if the oint in the PH diagram had a name (and guessing it didnt)
 
Actually was trying to make a point that if you have a mixture at a given P/T and you let down the pressure with a throttle valve (JT) its an isenthalpic process, so in the PH diagram you can draw a vertical line from your initial pressure to you final pressure and if it _dosnt_ cross the dew point during this process there is no condensation. Tf you only looked at initial and final state sometime you may ignore that actually the fluid passed through a two phase region and i believe that that could cause problems if you downstream process is sensitive to condensate (e.g. a fuel cell). So my isotherms in the figure was actually to demonstrate hw much you would need to preheat the gas (depending on your upstream pressure) if you wanted to avoid passing through the two phase region when letting down the pressure
 
"just was wondering if the point in the PH diagram had a name"

if it follows the definition for cricondentherm I would call it cricondentherm in all diagrams (in the same way of other critical points),
however, as for other critical points, PT diagram seems to me more immediate to interpret (visually).
About your problem (verify if there is intermediate condensation for a mixture along some line with a specified value for H) of course you may solve with a series of flash operations, may be you are looking for a more efficient option but in my opinion that could require some intermediate steps for a mixture...
 
I solved my problem using the PH diagram! But i was looking for a way to describe it hence the need for a definition. The PH diagram is like an infinite series of flash. IMO you shouldnt ignore the fact that you pass through a "region" where you have condensation, i think that in many cases you should expect some hysteresis and separation of the phases that would lead to condensate even though the flash routine would predict none.
 
Status
Not open for further replies.

Part and Inventory Search

Sponsor