Shruzy
Mechanical
- Jun 26, 2015
- 5
I am trying to apply a cyclic loading (pressure loading) to a simple cube with 27 elements in the form of Asin(wt) in abaqus. Based on what I read on this forum and other forums as well as the manual, I used the Periodic option in Amplitude to do this, with the parameters set as follows - initial amplitude=0, A=0, B=1, and 3 different cases for circular frequency, 2 pi, 10 pi and 100 pi. I then tried to plot this loading by using the Pressure (P) option in field output request while defining the model, and plotted this against time using the element face option for 1 second. I was expecting a sin wave in my plots with different frequencies but what I got doesn't make any sense to me. I have attached the plots here.
I am unsure if I am making an error while defining the amplitude or while plotting it.
Kindly pardon me if I have been unable to make myself clear. I will be glad to provide any more information required.
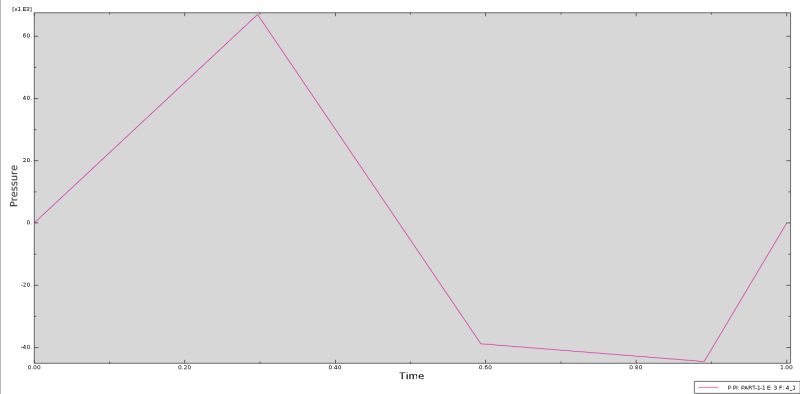
2 pi
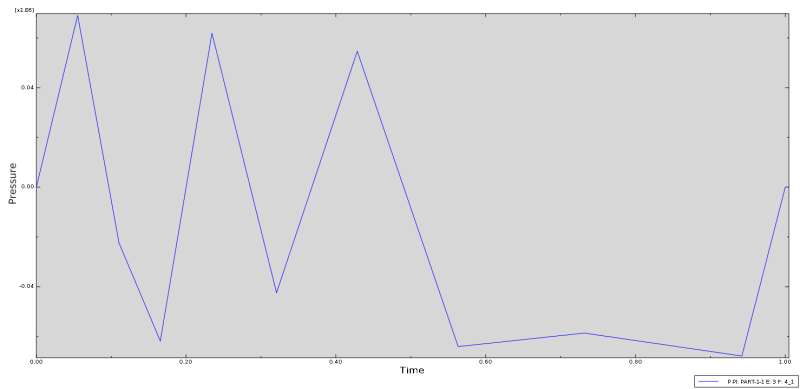
10 pi
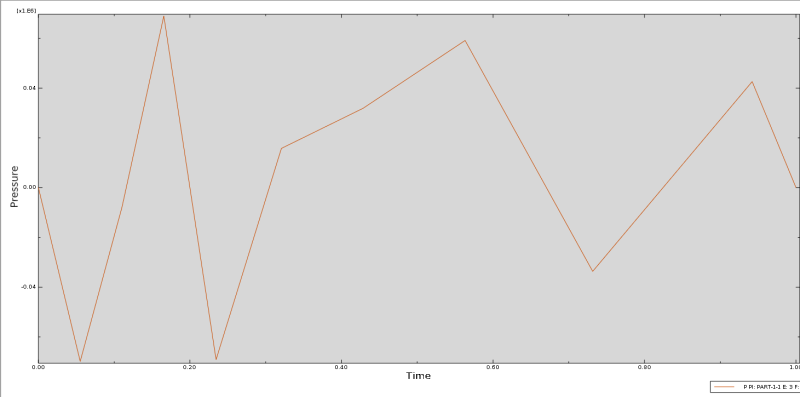
100 pi
I am unsure if I am making an error while defining the amplitude or while plotting it.
Kindly pardon me if I have been unable to make myself clear. I will be glad to provide any more information required.
2 pi
10 pi
100 pi