Dear experts,
I am a beginner with ANSYS Mechanical. I worked a lot in CFD with FLUENT, CFX, ANSYS ACT (acoustics)...so I am familiar with the GUI and the Workbench environment.
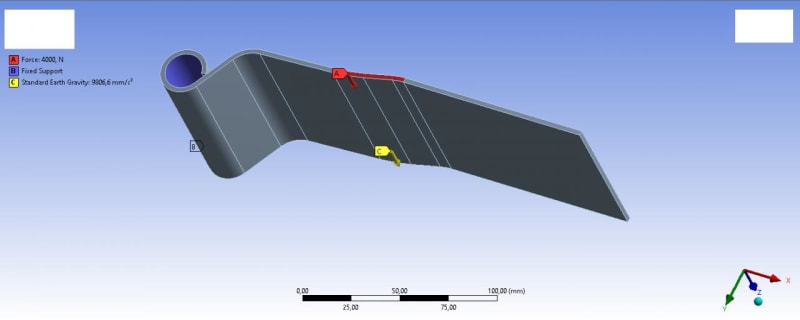
I am trying to simulate a load on a hinge with static structural analysis. Load of 500 kg, applied on an 50 mm long face located in the top of the hinge. Gravity is also included in the model. The part is fixed using Fixed support condtion.Please find attached a picture of the conditions imposed.
The dimensions of the part are around 24 cm long, 9 cm high and 0,3 cm thick.
I have information about the deformation for several loads.. What I did and will try to do (in a second step) is:
1. First I did a linear elastic analysis with several steps (increasing the load according to experiments) and compared the deformation results of the zone where the load is applied with test results. This provide good agreement between both results (FEM and measurements) except where larger deformations occur (around more than 400 kg where plasticity clearly appears). It must be noted that the tests are performed as follows: load applied, discharge, measurement. Without changing the part, load is increased and applied again, then discharge and then measure again. They repeat this process until deformation is relatively large (around 5 mm)
2. Having this in mind, I will try to include non linear effects to the model. I will do 8 steps (load:150 kg, load: 0 kg, load:250 kg, load:0 kg, load:375 kg, load: 0 kg, load: 500 kg, load: 0 kg. After each discharge, I will compute deformation of the zone where load is applied and compare with tests. I think this should give better aproximation in plastic region.
What do you think about this methodology? Do you think is a better approach due to the way experiments are carried out?
I think I will have to face with several problems in the non linear approach...sometimes I have seen error messages when switch non linear effects to "On"
I am playing with bilinear isotropic hardening and bilinear isotropic hardening. I am experiencing several converge issues (usually ANSYS tells that there are several highly distorsed elements...).
I think the good way to this (and follow closely the tests) is to do a load-unload including non linear effects and large deflections. But it tooks too much time to compute and the most of the time it does not converge...
I am using standard values for steel in isotropic/kinematic hardening. Do you think this is enough? What other things can I try? I am now using mostly hexaedral meshes.
The experiment measures the displacement where the load is applied (on a given surface). I try to track the same by checking directional deformation in suitable axis.
I am trying the adaptative meshing during runtime, but sometimes it doesn't work.
I am also trying to introduce multilinear s-s curve for stainless steel.
A few more info about my problem (really stuck on it). By reducing the mesh size (and temporaly suppresing adaptative meshing) I have managed to make it run a couple of times. Here I summarize what is happening:
1. The computation is higly inestabe, and using the same settings sometimes it converges, sometimes it doesn't.
2. Usually, when the simulation converges without errors, the results are not corresponding with tests (for a load of 500 kg we should expect a deformation of the surface where the load is applied of about 4-5 mm). The results are showing much higher deformation (around 20-40 mm). It seems that it lose the path during intermediate steps...
3.I tried to introduce s-s curve in order to be more accurate with material description, but using it (multilinear kinematic or isotropic), simulation crashes. I don't know if I should provide s-s values beyond the typical ones (true stres-true strain available in the state of the art, I mean, s-s clearly in the plastic zone...). If so, where can I find this values (curve or table) for example for stainless steel?
4. As I mentioned, the tests are carried out as follows: apply load, then remove it, then measure deviations from original position (in mm) where load is applied. So, I understand that in order to reproduce this, I have to consider non linear effects (the lower load they used is 100 kg which produce a deformation of 0,1 mm), in two steps: load and unload, and check what happens with deformation in the second step.
The elastic lineal approach give more or less accurate results for low loads (probably in the elasto-plastic region), but when plastic deformation occurs, lineal elasticity dramatically underestimate deformation, but considering the non linear effects it overestimate deformations a lot or even crashes.
I do not know what to do honestly...
Thanks for the support.
I include info of several runs (solver output) and pics of eng.data and the error I am usually obtaining.
Best,
LIAM
I am a beginner with ANSYS Mechanical. I worked a lot in CFD with FLUENT, CFX, ANSYS ACT (acoustics)...so I am familiar with the GUI and the Workbench environment.
I am trying to simulate a load on a hinge with static structural analysis. Load of 500 kg, applied on an 50 mm long face located in the top of the hinge. Gravity is also included in the model. The part is fixed using Fixed support condtion.Please find attached a picture of the conditions imposed.
The dimensions of the part are around 24 cm long, 9 cm high and 0,3 cm thick.
I have information about the deformation for several loads.. What I did and will try to do (in a second step) is:
1. First I did a linear elastic analysis with several steps (increasing the load according to experiments) and compared the deformation results of the zone where the load is applied with test results. This provide good agreement between both results (FEM and measurements) except where larger deformations occur (around more than 400 kg where plasticity clearly appears). It must be noted that the tests are performed as follows: load applied, discharge, measurement. Without changing the part, load is increased and applied again, then discharge and then measure again. They repeat this process until deformation is relatively large (around 5 mm)
2. Having this in mind, I will try to include non linear effects to the model. I will do 8 steps (load:150 kg, load: 0 kg, load:250 kg, load:0 kg, load:375 kg, load: 0 kg, load: 500 kg, load: 0 kg. After each discharge, I will compute deformation of the zone where load is applied and compare with tests. I think this should give better aproximation in plastic region.
What do you think about this methodology? Do you think is a better approach due to the way experiments are carried out?
I think I will have to face with several problems in the non linear approach...sometimes I have seen error messages when switch non linear effects to "On"
I am playing with bilinear isotropic hardening and bilinear isotropic hardening. I am experiencing several converge issues (usually ANSYS tells that there are several highly distorsed elements...).
I think the good way to this (and follow closely the tests) is to do a load-unload including non linear effects and large deflections. But it tooks too much time to compute and the most of the time it does not converge...
I am using standard values for steel in isotropic/kinematic hardening. Do you think this is enough? What other things can I try? I am now using mostly hexaedral meshes.
The experiment measures the displacement where the load is applied (on a given surface). I try to track the same by checking directional deformation in suitable axis.
I am trying the adaptative meshing during runtime, but sometimes it doesn't work.
I am also trying to introduce multilinear s-s curve for stainless steel.
A few more info about my problem (really stuck on it). By reducing the mesh size (and temporaly suppresing adaptative meshing) I have managed to make it run a couple of times. Here I summarize what is happening:
1. The computation is higly inestabe, and using the same settings sometimes it converges, sometimes it doesn't.
2. Usually, when the simulation converges without errors, the results are not corresponding with tests (for a load of 500 kg we should expect a deformation of the surface where the load is applied of about 4-5 mm). The results are showing much higher deformation (around 20-40 mm). It seems that it lose the path during intermediate steps...
3.I tried to introduce s-s curve in order to be more accurate with material description, but using it (multilinear kinematic or isotropic), simulation crashes. I don't know if I should provide s-s values beyond the typical ones (true stres-true strain available in the state of the art, I mean, s-s clearly in the plastic zone...). If so, where can I find this values (curve or table) for example for stainless steel?
4. As I mentioned, the tests are carried out as follows: apply load, then remove it, then measure deviations from original position (in mm) where load is applied. So, I understand that in order to reproduce this, I have to consider non linear effects (the lower load they used is 100 kg which produce a deformation of 0,1 mm), in two steps: load and unload, and check what happens with deformation in the second step.
The elastic lineal approach give more or less accurate results for low loads (probably in the elasto-plastic region), but when plastic deformation occurs, lineal elasticity dramatically underestimate deformation, but considering the non linear effects it overestimate deformations a lot or even crashes.
I do not know what to do honestly...
Thanks for the support.
I include info of several runs (solver output) and pics of eng.data and the error I am usually obtaining.
Best,
LIAM