I am having the following issue. I am trying to analyse the input and output signal of my filter using fft. However, I am not sure if my fft is correct. My input signal is the product of a sawtooth and sine waveforms both with frequencies 6kHz and 32kHz, respectively. Both individual signals have an amplitude of 1 before being multiplied.
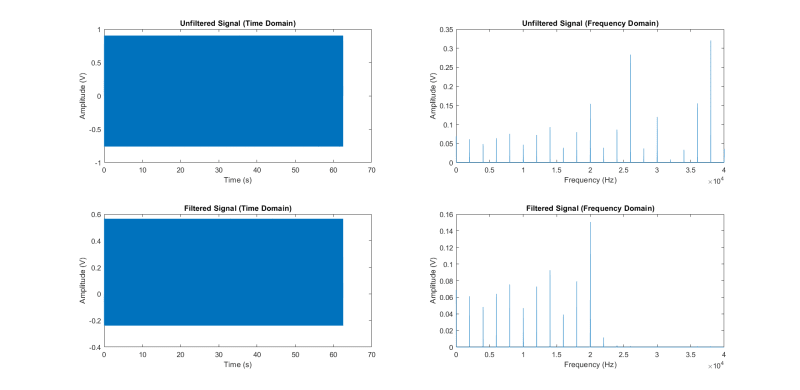
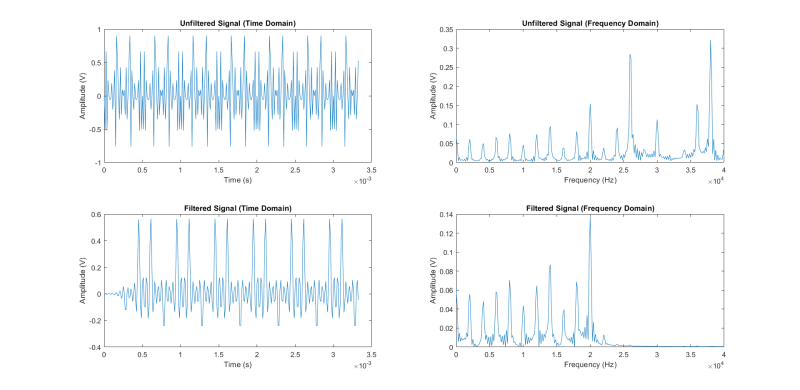
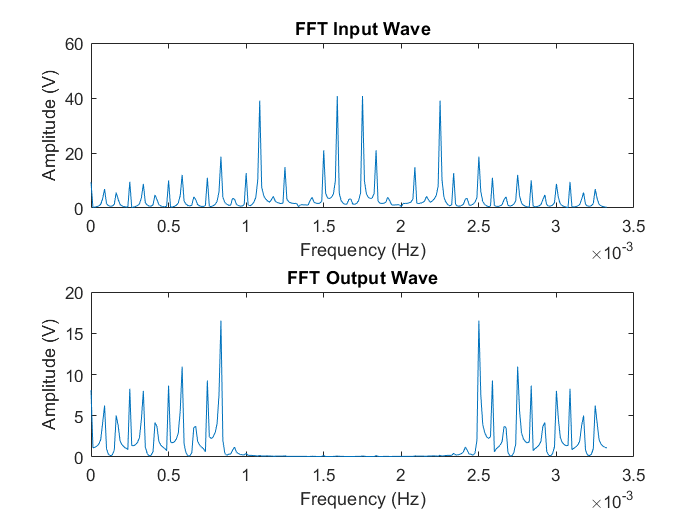
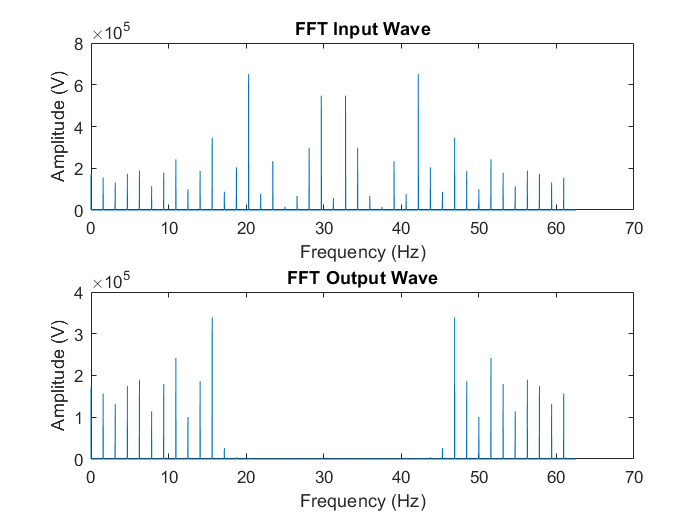
Depending on my time values I get different result for my fft plots. If I use values of time spaced out by the period of my sampling frequency, I get a "nice" looking graph with clear peaks as you would expect in a Fourier Transform (see Fig.1). However, if I use values of time spaced out by the period of the signal being sampled, the graph has more frequency components (see Fig. 2). I really don't know which graph is correctly displays my FFT. Also I have the problem that I used an online tutorial to achieve my FFT but I do not understand why the guy did what he did in his code which I do not understand. However, if I plot the absolute values of FFT, I get graphs with similar shapes but the amplitudes jump up to 30 or 40 more (see Fig. 3 and 4). Also for Fig.2 why is there a small wiggle at the start of the filtered signal (time domain) vs time ? Please your help in performing FFT accurately would be of great help. Thanks in advance.
Code:
%Time values using sampling frequency period.
fsampling = 80000;
tsampling = 0:1/fsampling:5000000*Tsampling;


%Time values using sawtooth frequency period.
fsampling = 80000;
fsawtooth = 6000;
Tsawtooth = (1/fsawtooth);
tsawtooth = 0:1/fssampling:20*Tsawtooth;


 %Piece of code to use FFT that I don't understand.
 L0 = length(product);
 NFFT0 = 2^nextpow2(L0);
 Y0 = fft(product,NFFT0)/L0;
 FreqDom0 = fs/2*linspace(0,1,NFFT0/2+1);


%Performing FFT using just abs.
 IPFFT = abs(fft(product));
 plot(t, IPFFT);
 plot(FreqDom0, 2*abs(Y0(1:NFFT0/2+1)));