Hi All,
Haven't posted in a while but I ran into something I am not understanding. And deep down I probably know the answer is way more involved than simple math but I am curious to know your thoughts anyway. Here is the problem. I have an air delivery table from a manufacturer that gives air volume vs SP. Keep in mind this is a variable speed ECM type motor. In the old days I got real fan curves with PSC motors and I could plot my system curve on it and get the operating points. Here is the their table:

I plotted this table in Excel and got this:
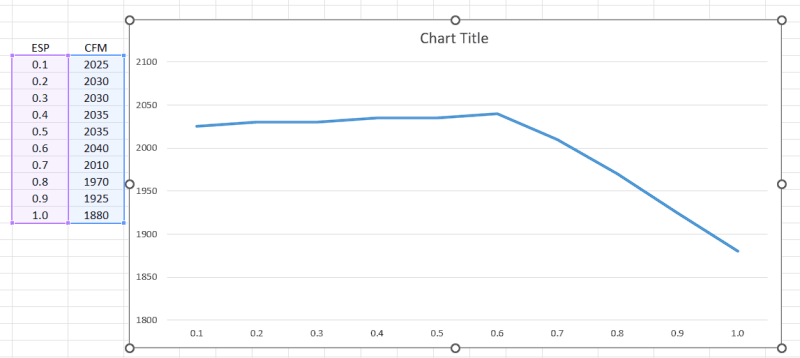
The manufacturer also states the RPM range of this motor is from 300-1300 RPM. So my first assumption is at around .6 SP the motor is running at full RPM and we see the normal drop off as the static pressure increases towards 1". From .6 and below the motor has to be ramping down in RPM to give the flat line we see in the chart.
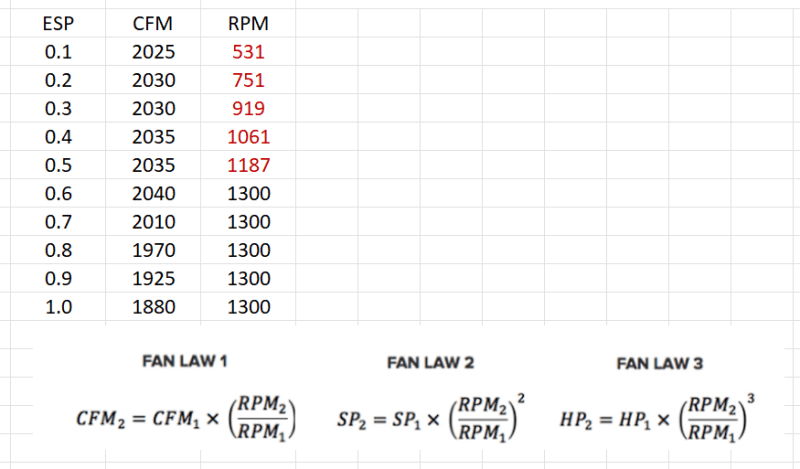
What is did next was to use Fan Law #2 to estimate the motor RPM at the lower static pressures:
Then I solved fan laws number 1 and 2 in terms of RPM2, set equal to each other and all the RPMs canceled out leaving me with CFM2/CFM1 = (SP2/SP1)^.5 ... Have no idea if that works but I got this:
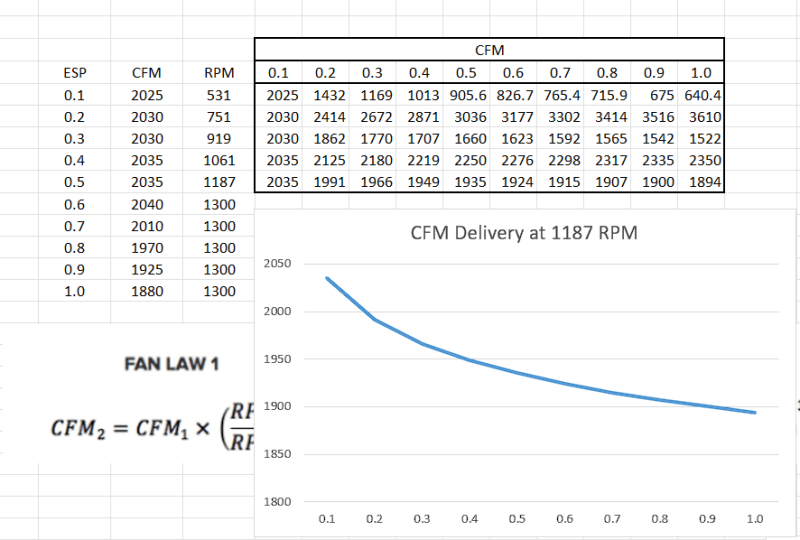
Obviously this is wrong. Like I say I am probably over simplifying what is probably a complex problem to solve. Anyone have any thoughts on the matter?
Thanks for reading,
Axis
Haven't posted in a while but I ran into something I am not understanding. And deep down I probably know the answer is way more involved than simple math but I am curious to know your thoughts anyway. Here is the problem. I have an air delivery table from a manufacturer that gives air volume vs SP. Keep in mind this is a variable speed ECM type motor. In the old days I got real fan curves with PSC motors and I could plot my system curve on it and get the operating points. Here is the their table:
I plotted this table in Excel and got this:
The manufacturer also states the RPM range of this motor is from 300-1300 RPM. So my first assumption is at around .6 SP the motor is running at full RPM and we see the normal drop off as the static pressure increases towards 1". From .6 and below the motor has to be ramping down in RPM to give the flat line we see in the chart.
What is did next was to use Fan Law #2 to estimate the motor RPM at the lower static pressures:
Then I solved fan laws number 1 and 2 in terms of RPM2, set equal to each other and all the RPMs canceled out leaving me with CFM2/CFM1 = (SP2/SP1)^.5 ... Have no idea if that works but I got this:
Obviously this is wrong. Like I say I am probably over simplifying what is probably a complex problem to solve. Anyone have any thoughts on the matter?
Thanks for reading,
Axis