In prosthetic foot development, there is a test called the ISO 10328 in which an Instron machine pushes on the bottom of a prosthetic foot (simulating walking) until a certain force is reached. The machine then returns a force vs. displacement graph which allows you to get an understanding of the prosthetic foot's spring properties. Usually you can see the force ramp up from zero to the max in the shape of a bell curve.
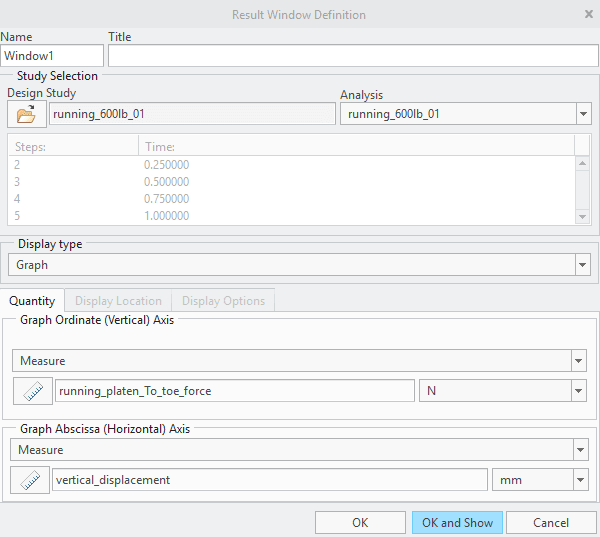
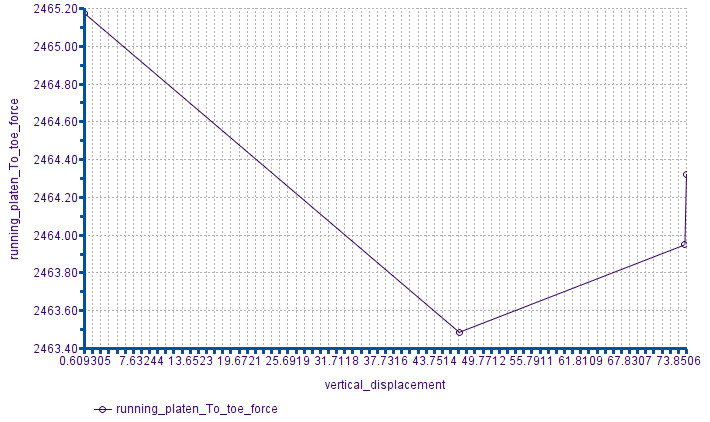
I need to replicate this graph in Creo Simulate to compare the FEA setup and the real-life prototype. However, when I use Measures I get this strange, nearly constant force plot with only four data points. The simulation doesn't operate the same as it would in real life: I think that instead of moving slowly into the prosthetic toe tip, the simulated machine rams into the simulated prosthetic toe tip trying to maintain constant force. This defeats the purpose of the simulation. The lack of data points is also a big issue. How do I fix this?
I need to replicate this graph in Creo Simulate to compare the FEA setup and the real-life prototype. However, when I use Measures I get this strange, nearly constant force plot with only four data points. The simulation doesn't operate the same as it would in real life: I think that instead of moving slowly into the prosthetic toe tip, the simulated machine rams into the simulated prosthetic toe tip trying to maintain constant force. This defeats the purpose of the simulation. The lack of data points is also a big issue. How do I fix this?