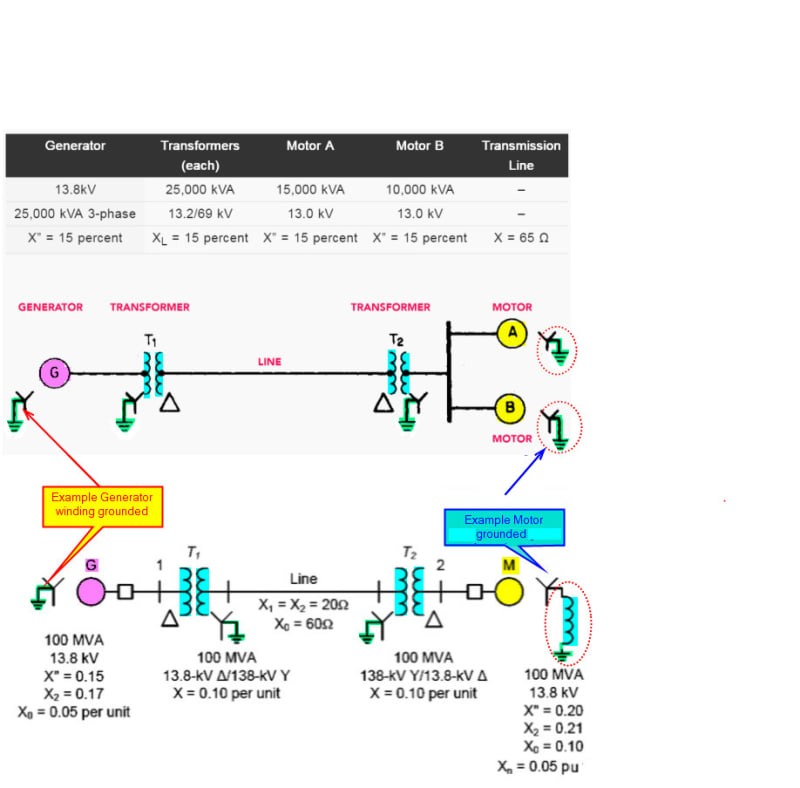
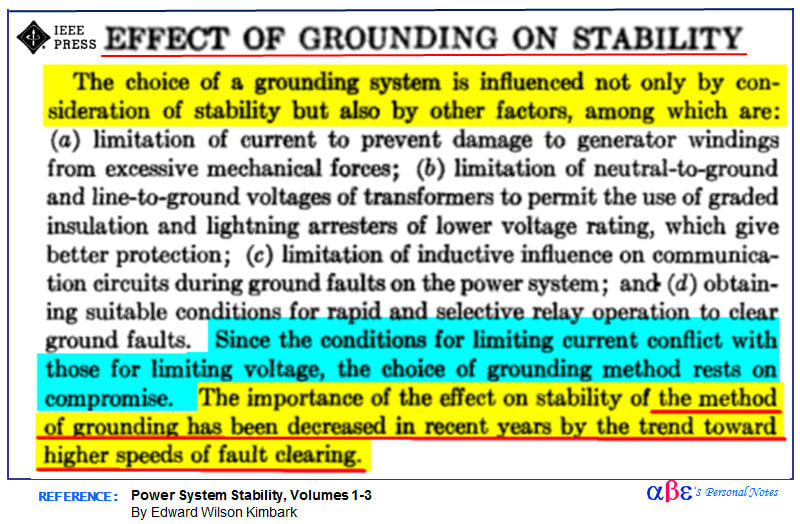
The graphics you're showing are for academic exercise only. They are not how power systems are typically designed. If I remember right, the first is used in a chapter teaching per-unit analysis, the second is used in a chapter teaching asymmetrical fault analysis using Thevenin-equivalent networks. Even though I used those diagrams while teaching because they were in the book(s) I used, I always pointed out the issues in them to my class when we went over those problems. I cringe to think about how many professors don't know there are significant problems in the diagrams and use them as-is. Just because a textbook shows something it doesn't mean it is correct. Where did you find these?
xnuke
"Live and act within the limit of your knowledge and keep expanding it to the limit of your life." Ayn Rand, Atlas Shrugged.
Please see FAQ731-376 for tips on how to make the best use of Eng-Tips.