Eng-Tips is the largest engineering community on the Internet

Intelligent Work Forums for Engineering Professionals

  • Congratulations waross on being selected by the Tek-Tips community for having the most helpful posts in the forums last week. Way to Go!

High Stress On Fillets Analysis - Static Linear Analysis 2

Status
Not open for further replies.

binsky3333

Computer
Jan 27, 2020
14
0
0
US
Hi all,

I am posting in hope of someone helping me analyze a high stress that I am seeing on a fillet in my FEA simulation.

For reference I am using Fusion 360 and running a static linear analysis. Everything else in my simulation is perfect except for this one fillet.

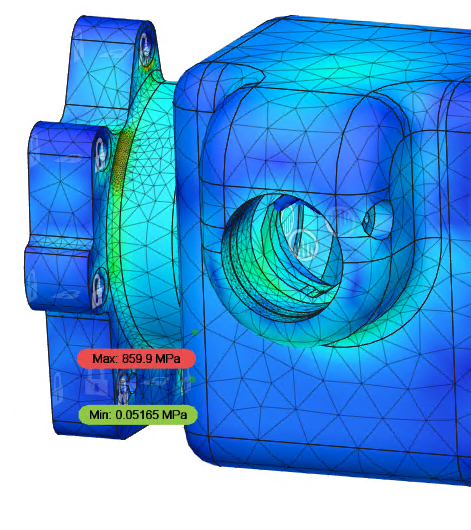
I am simulating with Aluminum 7075-T6 with a 455MPA Yield and 525MPA Ultimate.

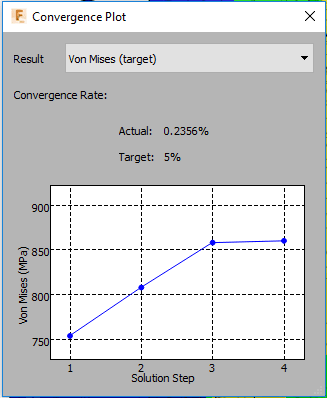
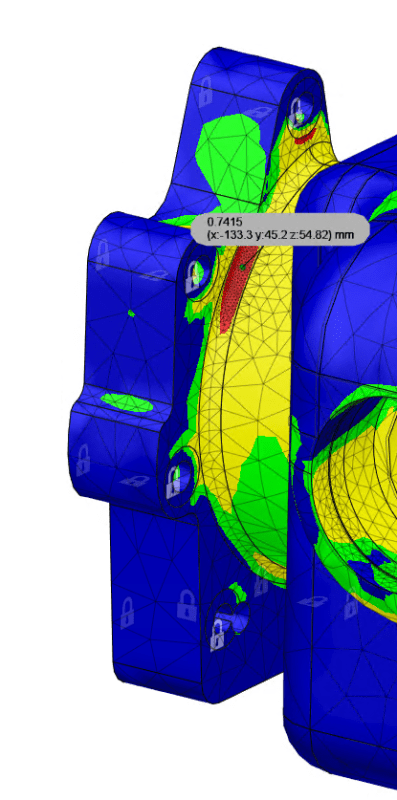
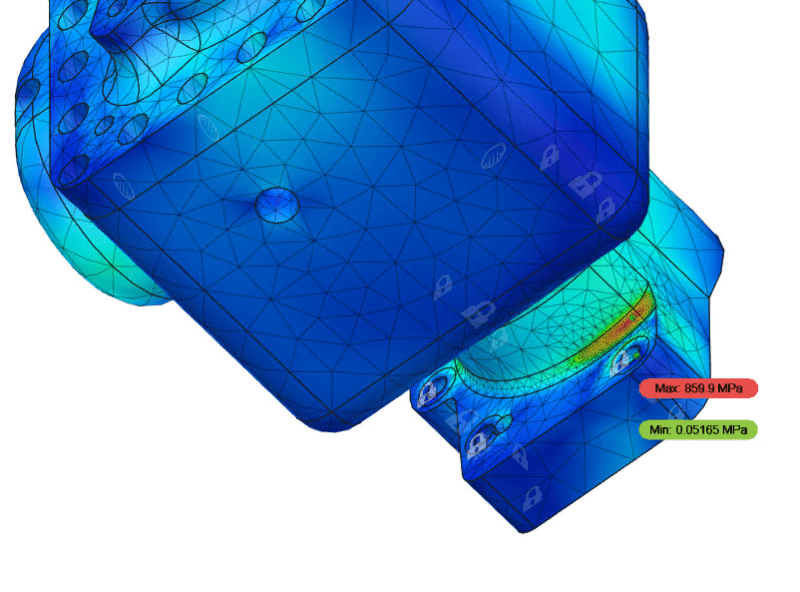
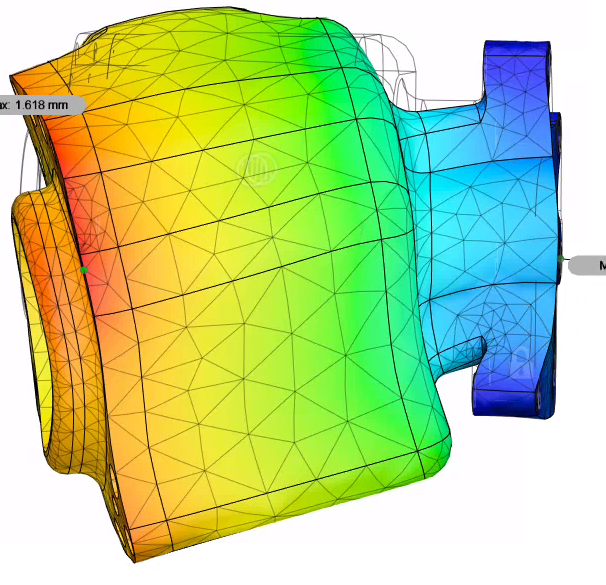
As a side note, my simulation does converge as seen below, so I know this isn't a singularity / hot spot / calculation error.

image_mhyveu.png


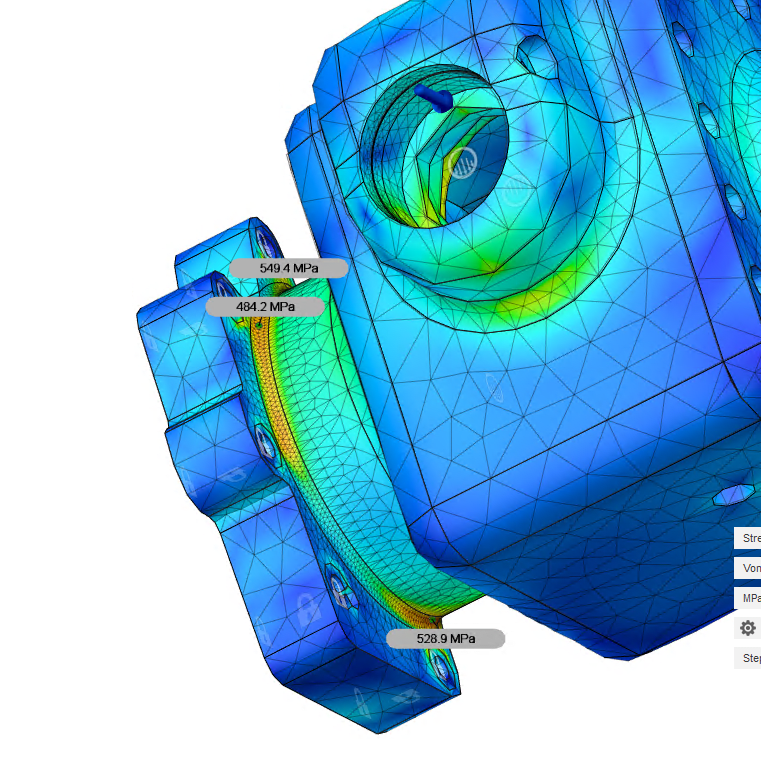
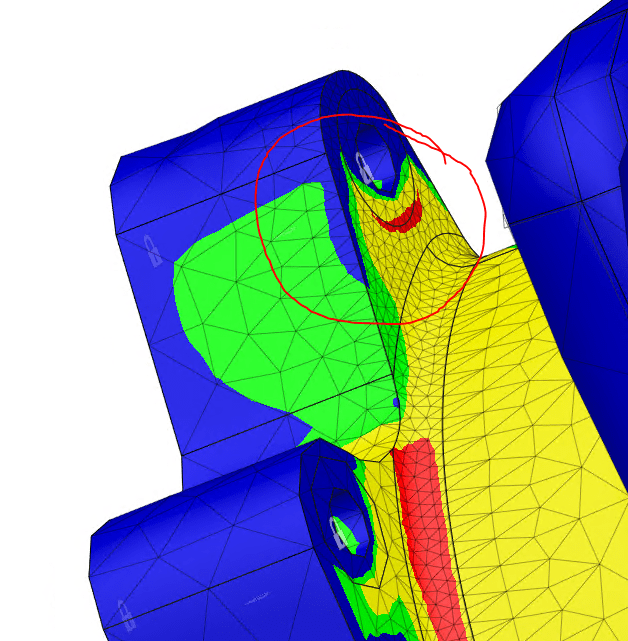
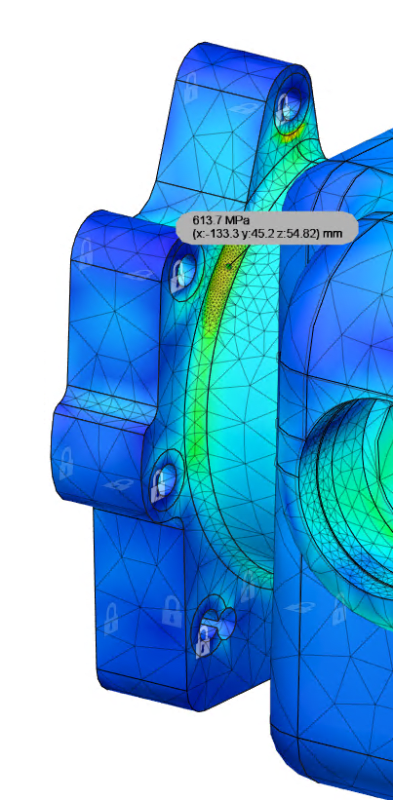
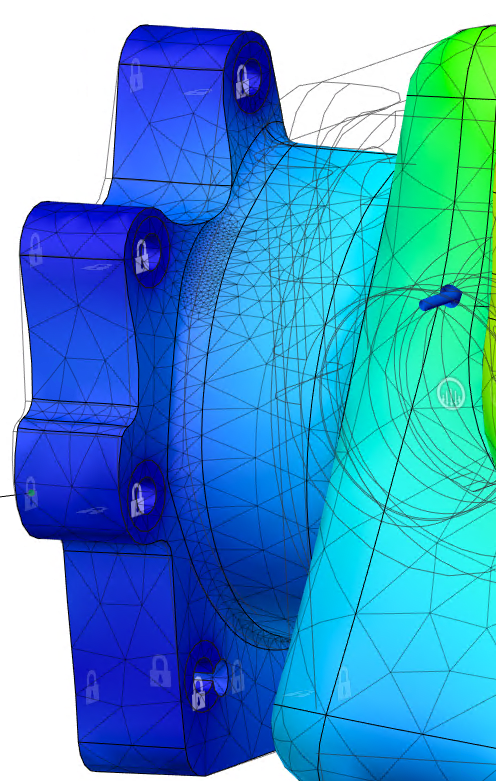
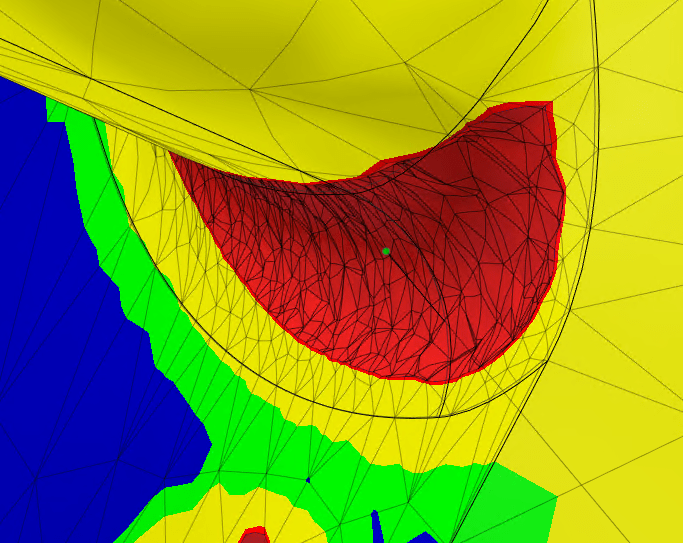
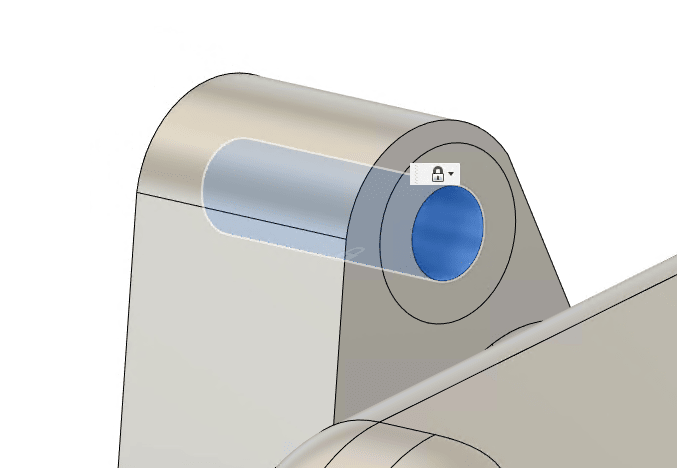
The stress on the fillet is pictured below. It is a 5mm fillet. Making the fillet small makes the stress area longer. Removing the fillet makes the stress area disappear.

image_glxdya.png

image_zasrry.png


I am confused about this because I see many mixed opinions on how to handle this:

1. Oh just ignore it, its artificial, stresses like that on fillets don't make sense.
2. You need to fix it and make it disappear or except a failure.
3. Since the effected areas volume is so small you'll see a local yield which wont make the whole part fail, but it will fatigue over time. Compared the max stress to a S-N curve to determine how many cycles you'll be able to get out of it.
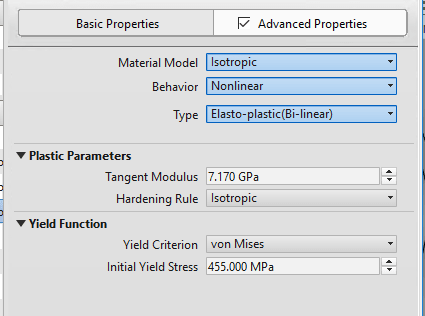
4. If you are really worried and don't trust any of the above, run a nonlinear analysis.

My personal analysis is leaning more towards number 1 & 3. Such a high stress on a fillet really doesn't logically make sense (I could totally be wrong), especially when the fillets actually bring out the stress in that area. Removing the fillet, the stress in that area goes away too. Since the effected volume is so small, its just a localized yield and those are OK and don't mean complete part failure instantly, just eventual fatigue failure over time.

Hoping someone can provide some insight on my personal analysis and tell me if I'm thinking correctly or not. I'm fairly new to FEA.

Many Thanks!
 
Replies continue below

Recommended for you

remember you're running linear elastic FEA (I think, apologies if wrong).

3 seems about right … some local plasticity, an issue if this is a fatigue load.

another day in paradise, or is paradise one day closer ?
 
Correct. A static linear analysis. Completely forgot to state that and have updated the title and description.

Appreciate your response. 3 makes a lot of sense to me as well and I'm glad I could get another opinion.

I do want to make a note that my FEA simulation is using loads seen at ABSOLUTE MAX conditions, that might even be slightly unrealistic or never seen that many times (cycle wise). So the amount of time this load is going to be hit isn't a lot. In this case its not going ton be constantly cycling.

I like that term "local plasticity," I will need to do some googling with that key word and see what other threads and info I can find.

Many thanks,

Matt
 
It's important to understand the source of suspicious stress concentrations. Since it's not a singularity, there must be a physical reason for such high stress. Maybe an error in boundary conditions or loads. Can you say more about them and show some pictures ?

Plasticity definitely should be included in this analysis. It may have large impact on results.
 
First, I'm confused. RB1957 said "remember you're running linear elastic FEA (I think, apologies if wrong)" You said "Correct. A static nonlinear analysis." Is it linear or nonlinear? With von Mises stress 35% over Sy, it sounds like linear elastic.

Second, if you truly have plastic deformation, an SN curve is no good. You have to use strain life data and analyze for low cycle fatigue.

Third, if its not a singularity, you cant just ignore it. Either examine your model and if you can convince yourself your model is right and its a real stress, then you have to deal with it. I agree with FEAway. Looks like a BC or load problem. Hard to tell because you dont show them. Looks like the bolt holes are constrained and the back face.


Rick Fischer
Principal Engineer
Argonne National Laboratory
 
Sorry it is a linear static stress.

Sure.

I am simulating a redesigned transfer case for an AWD vehicle. Its contain a ring and pinon gear set. Its a two piece design, but I am simulating that case plate as bonded. I have done the bolt calcs by hand and also have tried sims constraining the plate to the case to make sure it doesn't negatively effect the case and it doesn't.

image_c2eieg.png


The case itself bolts to a transmission that looks like such :

image_hdxrc1.png


I have my constraints setup as follows... basically the 5 bolt holes are constrained as well as a split face that the bolt head touches and a split faces that touches those offset bolt bosses on the transmission. I dont have the entire back of the flange constrained because only small faces make contact with the transmission.

image_oolzkj.png


The case has 4 combined radial bearing loads (represented as bearing loads) and 2 axial loads (represented as regular force loads).

Here are the pinon loads:

image_gmvbxk.png


Here are the ring gear loads:

image_tqm4gs.png


Here you can see we have high stress in two areas on the same fillet. One near the bottom and one near the top:

Bottom:

image_ynbiml.png


Top:

image_h6ngfg.png


Looking at an extremely amplified view of displacement you can see the structure buckling near that bottom one, which is maybe causing that high stress area on the fillet?

image_zymcbh.png


The top is basically seeing the opposite and getting pulled apart (kinda hard to see without stepping through the scales).

image_fenif9.png


What i just really dont understand is why the stresses in that area go away when the fillet is removed. I would think a finely meshed fillet would help alleviate them.

Hard to tell but the stresses are also really only on the surface. They dont extend deep into the piece.

image_y6kyvn.png
 
I too am confused on whether or not you are running a linear or non-linear plastic analysis? If you are running a linear analysis (which agrees with your title and verbiage but conflicts with the fact that you showed screenshots of your convergence method) then I would say I agree with number 3 and 4. If this is a nonlinear analysis, then it's hard to say what could be causing it. Since you say that removal of the fillet makes the plasticity go away, it would seem that there is something about how it is modeled that is causing it. Boundary conditions are a common culprit. Can you simplify your boundary conditions and load case and run a linear analysis.... check your displacements and stresses and see if the model is behaving correctly? Then introduce the correct boundary conditions, load case, and non-linear analysis one-by-one to see if you can spot the issue?
 
Are these first or second order tetrahedrons ? Consider refining mesh in other areas as well (especially for the flange). I would also focus on boundary conditions since they are really close to these stress concentrations regions. There are various approaches to bolt modeling, try some of them and check their influence on the results.
 
F360 by default is second order tetrahedrons.

Continuing to play around with it tonight... I decided to try all of the different permutations of simplifying the BC's and loads.

I am using adaptive mesh refinement and making sure that the results from all of my simulations converge as to make sure there are no singularity's.

1. Full Load & Constrained Bolt Holes + Bolt Head Faces - Result can be found in previous posts. Very high stress on fillet. 860 MPA on lower fillet (0.52 Safety Factor).
2. 1/2 Load & Constrained Bolt Holes + Bolt Head Faces - High stress point in the exact same position as 1 but at exactly 1/2 the stress at 340MPA (1.05 Safety Factor).
3. Full Load & Constrained Flange Face (full back face) - High stress point in the exact same position as 1 & 2 but 486 MPA (0.93 Safety Factor).
4. 1/2 Load & Constrained Flange Face (full back face) - High stress point in the exact same position as 1 & 2 & 3 about exactly 1/2 the stress at 233 MPA (1.94 Safety Factor).

So the stress location is staying constant based on varying BC's and loads. Its hard to tell how and why that stress is originating. There is no displacement around or on it, it doesn't clearly stem from anything else, just kinda appears very thinly out of nowhere.

I guess I will have to try connecting more of that flange to the case. Specifically in the regions near those high stresses on the fillet.

 
is this an FEA package inside a CAD s/ware ? I'm looking at your constraints and it looks to me like you're constraining the surface (something I see in CAD FEA). I think you need to be careful with this type of constraint, it is easy to over-constrain the model which will create problems in the FEM results. Now I doubt this is causing your stress peak. I think you've a mild stress concentration, exaggerated by the linear FEA. If this is a fatigue load case and you're seeing plasticity then that's probably a bad sign. I suspect the only practical solution is to increase the fillet rad. There are other treatments but not really suitable for mass production. Possbily a material change ?

Probably you want a fatigue test. You may want to consider something we know (in aircraft structures) … an overload really helps the fatigue performance. if you load to 120% the fatigue load you'll set up a plastic zone in this area and that'll create compressive stresses to retard the fatigue of the fillet.

another day in paradise, or is paradise one day closer ?
 
@nlgyro

Thanks for the response. I am going to do some further research on neuber correction. It seems to me this is an alternative to doing a full blown non-linear analysis.

@rb1957

Correct this is a FEA package inside of my CAD environment. Autodesk Fusion 360 has an integrated simulation environment. Let me better show how I have my constraints setup. Basically I am constraining the bolt holes as well as the area the bolt head touches and the area the flange touches on the transmission bosses.

Are you saying that constraining just those surfaces could cause issues? Attached are 3 images of the areas I am constraining.

1.Hole
2.Bolt Head Face
3.Tranmission boss face

image_emdcqn.png

image_emzdpo.png

image_guxj2i.png


Maybe it will be worth my time to run a non-linear analysis as well. I do have access to that in my simulation package.

I assume if I see the same stress concentration occurring in a nonlinear analysis then its not a mild stress concentration being exaggerated by linear analysis and is a very big problem.

I unfortunately don't have access to any fatigue loading simulations. This item is going to be used for drag racing and its really only going to be seeing these crazy forces in 1st gear, so it is ok if the cycles are limited. Maybe its time to switch simulation software.

On a side note, I really appreciate everyones time. This forum really does have a great group of people, so cheers everyone!
 
yes, that's what I thought. I suspect that locking surfaces in this way is overconstraining the model and not, IMHO, good practice.

But I also doubt that it is affecting significantly your stress peak.

The key thing to understand is the loading … is it an extreme static case or something typical, representative of fatigue loading ?

An interesting sidebar would be to look at the current transmission piece (or something similar) … if it shoes a similar stress peak and has acceptable service experience then you have your answer (it looks acceptable).


another day in paradise, or is paradise one day closer ?
 
OK... So I ran a non-linear analysis and the results are pretty interesting.

I still have stresses in the same spot, but the magnitude is quite smaller. I am now seeing around the 480-530 MPA range (which is barely above yield), where before they were 860 MPA... [surprise]

Here is how I setup my material:

image_czrnmb.png


And here are the results...

image_lu5iyf.png


I think its safe to say now that the stress concentrations were definitely being exaggerated by the linear analysis. From my understanding non-linear takes into account not only non-linear area of the stress strain curve of the material but also the change in stiffness in the high stress areas.

Let me also give a little more background on the problem...

So basically the setup for this is as follows... the engine is connected to the transmission and this AWD transfer case is connected to the final drive of the transmission and it sends torque to the rear.

Since its connected to the final drive the input torque it sees is pretty massive. In this gear the ratios are as follows...

1st gear - 3.07
2nd gear - 1.77
etc etc
Final Drive - 4.00

So I want my case to be able to handle 1000nm engine torque in all gears with the possibility of 100% torque being sent to the rear wheels through this case. This would happen if the front lifts or the front loses traction.

So if we multiply things out our input into this gear set becomes...

1000nm * 3.07 * 4.00 = 12280nm
1000nm * 1.77 * 4.00 = 70008nm

Then basically since its hypoid spiral bevel gear set I can calcualte the gear tooth forces and then calculate the combined radial and axial bearings loads which I then use in the my FEA...

I am reusing the stock gearset, just creating a stronger case and explained more of my gear tooth / bearing load calcs here :
So basically I am simulating the absolute max condition it would see in 1st gear with 1000nm engine tq and 100% to rear. This is slightly unrealistic as 1000nm engine torque in 1st gear is massive, usually the engine can't build enough load to even produce that and only 100% torque would go to the rear if the front of the car completely lifted off the ground.

My ideology is that if I can design a case strong enough to withstand that absolute maximum even if its slightly unrealistic it should be indestructible at more realistic conditions such as lower torque and less torque transfer to the rear. And this also gives me some wiggle room for possible error in my gear math. As you go up to 2nd gear you can see the forces basically 1/2 and at that point all of the stresses are gone and this is still assuming 100% tq transfer and its usually 50%.

Ive never seen the stock case fail at the flange area. Usually it always fails at the pinon area, but because the pinon area was never strong enough maybe it wasn't possible to put enough torque through the thing to see failure at the flange area.
 
Here you can also see my constraints causing some issues. This IMO is totally safe to ignore. Thats clearly being caused by the split face that is constrained (to represent the bolt head).

Any suggestions on how to better constrain this? Presumably without modeling bolting this piece to a plate (transmission).

image_kxumtx.png
 
If you are applying extreme loads then mild stress concentration is acceptable, because fatigue loads are much lower.

From your NL run you're predicting a peak stress of 550MPa (quite a bit above the yield of 450 MPa). What's the endurance limit of your material ?
from your linear run the peak stress was 850 MPa, so you need to say fatigue loads are 50% of the extreme load before you don't get yielding under fatigue loads (which you want to avoid). At the endurance limit (ok, there isn't one for Al) is much lower than that.

Your later post is a stress concentration at a spot face. This is also near one of your constraints. Which is causing it ? both are ??

another day in paradise, or is paradise one day closer ?
 
OK. A lot of this is starting to make a lot more sense... so let me recap in my own words to make sure I am on the right page.

When analyzing local stress concentrations we must do the following:

1. Perform a linear analysis on the piece
2. Make sure that our simulation is converging so that we know for a fact this is real stress and not a singularity due to poor meshing.
3. If the concentration isn't yielding and we want to determine fatigue cycles we can use a S-N curve. All is good.
4. If the concentration is yielding and its a very high stress spike, we should either use a nueber correction or run a non-linear analysis to get a better idea of whats going on.
5. If the non-linear analysis returns lower stresses we know the stresses in the linear analysis were exaggerated.
6. If we are in the elastic deformation range we can use a S-N curve to determine fatigue. If we are in the plastic deformation range we can now use a Stress Life curve to determine low cycle fatigue.

In this case since my stress concentration is small and local I can use a stress life curve to see how many cycles I can get out the piece at this extreme load.

 
Status
Not open for further replies.
Back
Top