Hi there,
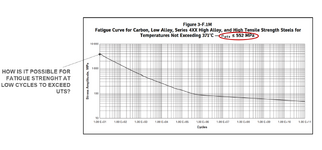
I've been racking my brain on this for a while so it's time to seek some advice from others in the field. I'm getting up to speed with using the BPVC fatigue calculations in BPVC Section VIII Div 2. One thing I can't reconcile is how come the S-N curves in the BPVC show a stress amplitude that's greater than the UTS of the material? I would expect that at low cycles, the curve would be capped at the UTS but that doesn't seem to be the case. My first thought was it that maybe the stress amplitude was defined peak to peak for these curves but from what I read that doesn't seem to be the case. What am I missing here?
Thanks,
Owen

