Eng-Tips is the largest engineering community on the Internet

Intelligent Work Forums for Engineering Professionals

Inclinometer Data Evaluation

Status
Not open for further replies.

learning2geotech

Civil/Environmental
Apr 4, 2019
38
0
0
US
Hi,

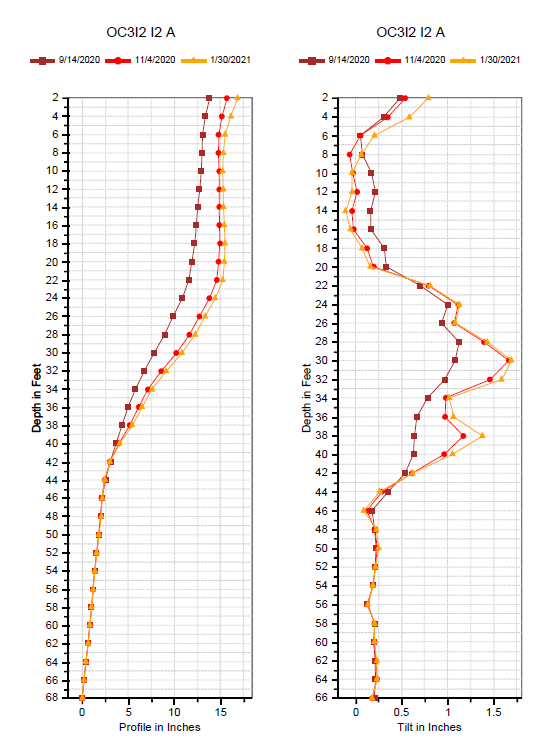
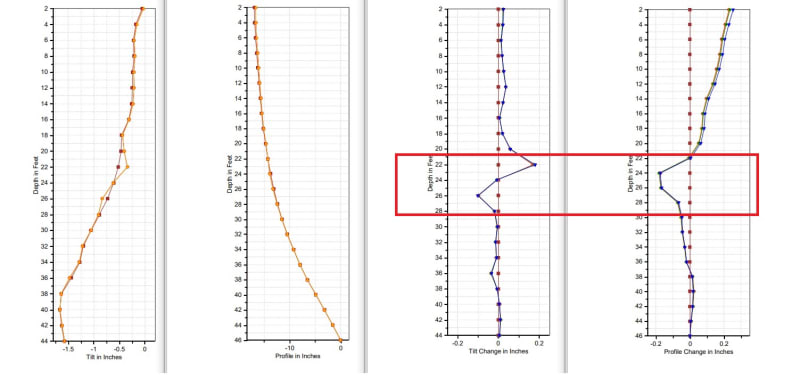
Please see attached photo. I understand that the tilt is calculated by sin(angle between the top and bottom wheels) times the probe length (2 feet). So how can the tilt readings at 22' and 26' changed significantly while the reading at 24' remains relatively the same, when the bottom and top wheels have to be at 22'-24' and then 24'-26'
 
 https://files.engineering.com/getfile.aspx?folder=60b58ed6-c2ed-47fa-be3f-ac058b4b281e&file=Digipro.jpg
Replies continue below

Recommended for you

I'm not sure, but I am not used to looking at the tilt graphs. What do your cumulative and incremental displacement graphs look like? Also, the profile graph can sometimes give a hint as to what is happening. I once had some weird results and it turned out that there was a portion of the casing that was unsupported from the grout (a void). The upper portion was settling and the casing was buckling in a spiral pattern.
 
I typically do three readings to establish the base line. Obtain another reading or two to rule out operator’s error. Look at the trend over time. Also, if you have other inclinometers compare data at same depth/elevation. You should be fixing the bottom to 0 not the top if you are capturing a landslide. Finally if your casing groove is not perpendicular to the anticipated landmass movement, you should look into the perpendicular direction and obtain the resultant.
 
Panars,

The plot you posted is confusing, at least to me. The horizontal scale is labeled "Tilt in Inches". Tilt is measured in degrees. Movement is measured in inches. So which is it? Also, why does the plot assume zero tilt/movement at the ground surface? Is the presented data compared to a base line or is it compared to vertical?

Mike Lambert
 
GeoPaveTraffic,
I was not the OP and I did not post the plots. I was responding to the OP.
The DigiPro software from Slope Indicator does report tilt in inches. One must assume that this is the horizontal distance that the upper wheels are offset from the lower wheels.
For the tilt to be zero at the top of the plot, the casing would need to be vertical at the ground surface. I can see this being the case, as the augers will start off vertical and tend to drift with depth.
Only the cumulative displacement graph (or profile change in DigiPro) would require a comparison to baseline. The profile and tilt plots do not require the comparison to a baseline. Each reading would have its own data line.
I took some inclinometer readings that I have and plotted the A axis with profile on the left and tilt on the right. See below. It seems to make sense to me.
I think the OP should look at the profile graph. From that it should be easier to figure out what is going on.

oc3-profile_w9ufvt.png


Note that this set of readings is from the foundation of an embankment where we were measuring lateral squeeze. So the fact that there is no sharp break at a shear plane is to be expected.
 
Panars,

It is also my understanding that the tilt shown by Digipro is the horizontal distance between the top and bottom wheel. That's why the depth reading for the tilt is 2' less than the total depth. Using your example, the tilt reading starts at 66' while the total depth is 68' because the distance between the top and bottom wheels is 2' and the tilt is the horizontal displacement between the top and bottom wheels.

I was looking at the tilt because i was trying to understand what is going on between approx 22' and 28'. See attached photo for the tilt, profile, tilt change, and profile change graphs. While the profile graph looks normal, the "tilt change" and "profile change" graphs show abnormality. Have you ever seen something like this?
Digipro2_dnllfq.jpg


Thanks learning2geotech. Those additional graphs help a lot.
Looks like you definitely have a shear plane developing at 23 ft.
One possible explanation for the apparent movement in the wrong direction (negative movement in profile change) is that you have a bias shift in the second set of readings. This can make it appear that you have a negative profile change below 24 ft. However, I don't think this would explain all the apparent movement in the wrong direction.
Do you have a compressible soil layer? It could be you are getting a little bit of buckling in the casing pipe between 20 and 28 ft.
The change in tilt indicates that the convex bend of the casing (as seen in the profile) is getting more convex between the depths of 20 and 28 ft.
 
learning2geotech,

Some questions to help us better understand your questions and plots that you are posting.

1. Is the bottom of the inclinometer casing founded in material that is considered stable? If so, you should really sum movements from the bottom, not from the top.

2. Was baseline data collected? If so, how many sets on the same day? Are you processing the data using the base line or just each set of data independently?

3. Is the data being collected by reading the casing twice, once with the high wheel upslope and once with the high wheel downslope?

4. Have you looked at the checksums to determine the quality of the data? The checksums should be consistent for all of the readings regardless of depth.

5. What does the "B" channel data look like?

6. How was the space between the borehole wall and casing backfilled? Grout? Sand?

7. What is has the weather been like when the readings were taken? If it is hot or cold, then the probe needs time to warm/cool in the bottom of the casing prior to starting to take readings.

I've been using inclinometers for over 30 years and have seen about every type of data problem that you can imagine. I'm a fan of reducing the data by hand, using a spreadsheet, instead of the digipro software. Just to many data checks you can do by hand that are difficult with the software.

Mike Lambert
 
Status
Not open for further replies.
Back
Top