Sure. The reason I posted was to see if anyone else wanted some ideas. I did not find a ton of great examples when I started, so I thought others might be interested. I will share a number of things for the benefit of others, so do not be annoyed if I drone on a bit.
I started looking into using python after watching some different you tube videos suggesting engineers should be thinking about using Python in practice. Over the past few years I have found a number use cases, and with AI, you can start without being an expert programmer like Celt, Sticks, or IDS. I have found a ton of examples where people go on and on about creating a web app, but honestly, have close to zero interest in that. I have no aspirations of becoming some expert coder that comes up with something to sell. I am old and tired of some stupid daily tasks I must complete to do my work. The goal at the end of this is to spit out a .pdf to put in a file. I am getting closer to having that.
The first thing to think about is how fancy you want your output. It is easy to get things to display nicely on your screen with html, but to convert that to a .pdf that most of us want can involve a few steps. Tables and engineering variables have proven to be the biggest hurdle for me. I will share a bit about my testing of both separately.
Most in the PHd world are using LaTex to create their pretty documents in the standard format their institution requires. A common tool most seem to use is Overleaf. I tried that, but it does not work well if you want to avoid copying values from one document to another. It is great for making assigments if you are into that kind of thing. I would not mention this if not for the fact that using LaTex in your coding is very useful to create nice looking documents.
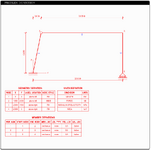
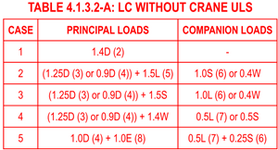
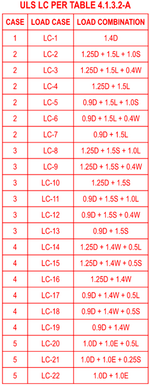
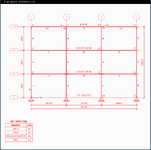
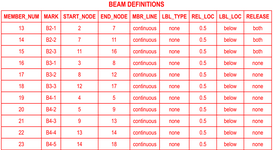
Tables, ahh, such an important thing for us. This is probably the most valuable part of Python for a structural engineer. I routinely export multiple spreadsheets from SAP2000 and do the same stupid editting to each sheet. Such a waste of time. I will be dumping complete data sets into python in the future to post process them. Once I create a definition, it will redo the task in seconds exactly the same each time. Now why are tables a problem? There are a few differnt ways you can create them in python, but those look terrible to me. You can code fairly decent looking tables using LaTex, but I would like the tables as I am working. The advantage of LaTex, is you can create a .pdf with that. Direct creation of the .pdf using LaTex is very nice since it allows you to contols endless parameters very efficiently. I decided to use HTML and CSS coding for my tables. This allows you to create very nice tables, but converting those to a .pdf file turned out to be a pain. I am working on a 2D frame analysis tool (start below) for future projects, and it took hours yesterday to get the stupid tables from HTML to PDF, and then cropped so they display correctly. Now that I have completed the process I have general definitions that will work for data frames in the future very easily. You are probably thinking, but I do not know HTML coding or CSS very well. Neither do I. I worked with ChatGPT for a great number of hours going back and forth trying to get it to work. In the end, I am pleased with the result. If you start with ChatGPT you will quickly find you will need to pay for it unless you are more patient than I. The free version times out after so many interactions. I tried the AI within Jupyter as well, and am finding GPT works better to keep your interactions. There are tons of AI tools out there, and I am sure others know far more.
Now the engineering variables. Any of that have used Excel or other programming tools have used alternates to greek letters in their projects. Conner Ferster developed
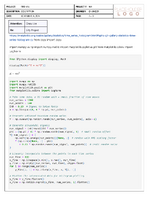
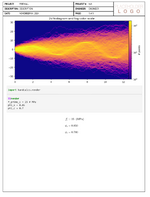
HANDCALCS to use in Python. It allows you to use proper greek letters in your code cells. This is wonderful since you can display your forumula exactly (or near enough) as you see in our code books. The downside is it uses CSS styling. That did not turn out super easy to get into a .pdf file, but I did eventually get it to work as you can see above. If you are fine with using f'c or phi_s for your variables, you may want to avoid this if you elect for a simple table output.
Now to your question. I will assume you want nicer looking tables and greek variables. It is not that difficult once setup, but it takes some patience to go thru the setup. I attached a .txt file with this that outlines the process for myself when I forget.
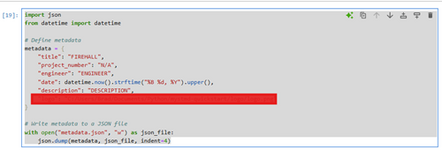
- The header in the calculation sheet is filled out using a small code cell at the start of the notebook (image below). This creates a small .json file that is stored in your project folder. Once that is created you do not need the code any longer unless you want to change it or use different project headings. In the example image you can see I was adding metadata to the project file. I tested that to see if I could get that to work, but I found the simple file was easier with the output I wanted.
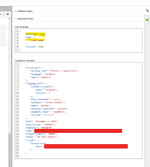
- To control which code cells appear you need to set the metadata in your notebook. You can hide the cell input, output or complete block. When you create your html file these cells will still appear. Those rules are applied when you convert the html file to the pdf you want.
- To create the html file that is needed for the pdf creating you can simply File--> Save and export as ---> HTML. I do this usually from a terminal.
- To convert the html file to a .pdf I am using NBConvert. That applies the rules where text can be located, applies the cell metadata, and outputs the pdf.
If you avoid the complicated tables and variables, things are easier. In that case you could use MYST markdown, Quarto, or export direct to .pdf from Jupyter. If going straight from Jupyter you would need to setup the templates to work as you need and figure out how to make it use the metadata in your code book. I do not think that would be too difficult, but I am sure it will waste the better part of a day by the time you get it to work. To use MYST markdown you can create a template. They have videos. I did not go very far down that path given the parameters I set.
You will find more of the explanations in the text file. I know it seems like a collosal pain, but it is not. Creating the templates was a pain, but you have a basic outline you can edit. I think I will be able to use MYST markdown to create the html files in the future. The advantage of this is it will add a lot of useful feature to make a complete calculation book that has all your files in one place neatly referenced with a table of contents that does not involve manual work.
If you are looking for more python infomation I suggest:
- Timo Harboe Zollner. I recently found him on youtube and he has some helpful videos.
- Structural Python (Connor Ferster). Connor is a Canadian engineer. He was consulting, but it seems now he has moved towards teaching python. I do not follow the live coding streams many of these guys have, but it seems common amoung coders.
