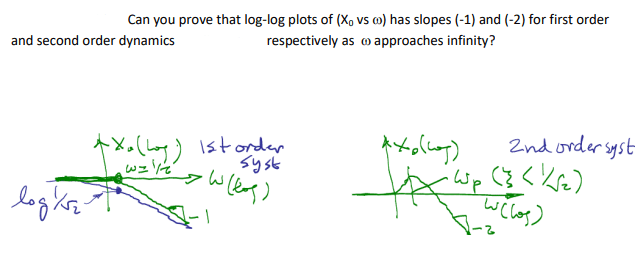
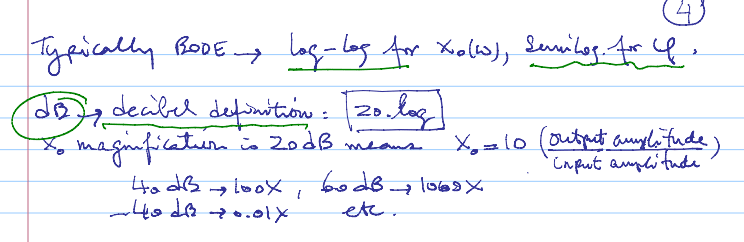
this is what I can explain regarding first-order dynamics and the difference between this and second order is just the damping ratio is involved in the second-order characteristic equation and the highest degree is 2 and the plot you get for frequency response of the log-log plot of x vs w is already given in above pictures.
I think as the ratio is constant for the change in vertical vs change in horizontal for 1 st order dynamics thus, we get a 1 slope, and the reason it's negative is the inverse relation between w and x.
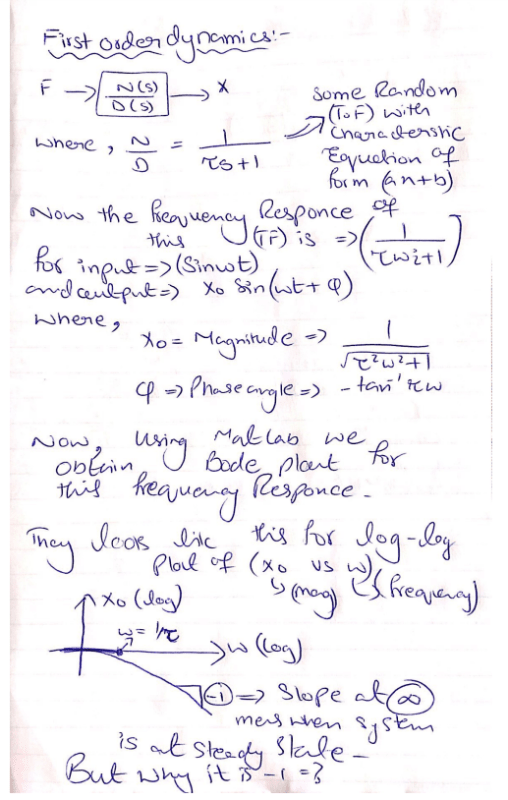
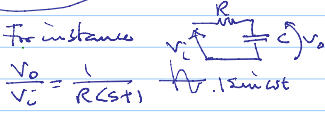
that is the general equation, we can have any value of taw in there. As in this image, the taw is RC, but the main idea is no matter what is the taw, the plots will remain the same at a steady state. with the slope of -1 for 1st order systems.