Eng-Tips is the largest engineering community on the Internet

Intelligent Work Forums for Engineering Professionals

  • Congratulations waross on being selected by the Tek-Tips community for having the most helpful posts in the forums last week. Way to Go!

Lumped systems

Status
Not open for further replies.

Dagal

Mechanical
Feb 19, 2023
7
0
0
IL
Hi all,

Let's say I have a material that is heated to a initial temperature. We can assume that the material is lumped system (according to the Biot number calculation).
The material was heated and now its sits next to an air conditioner, which helps the cooling down to the room temperature: 25[c].
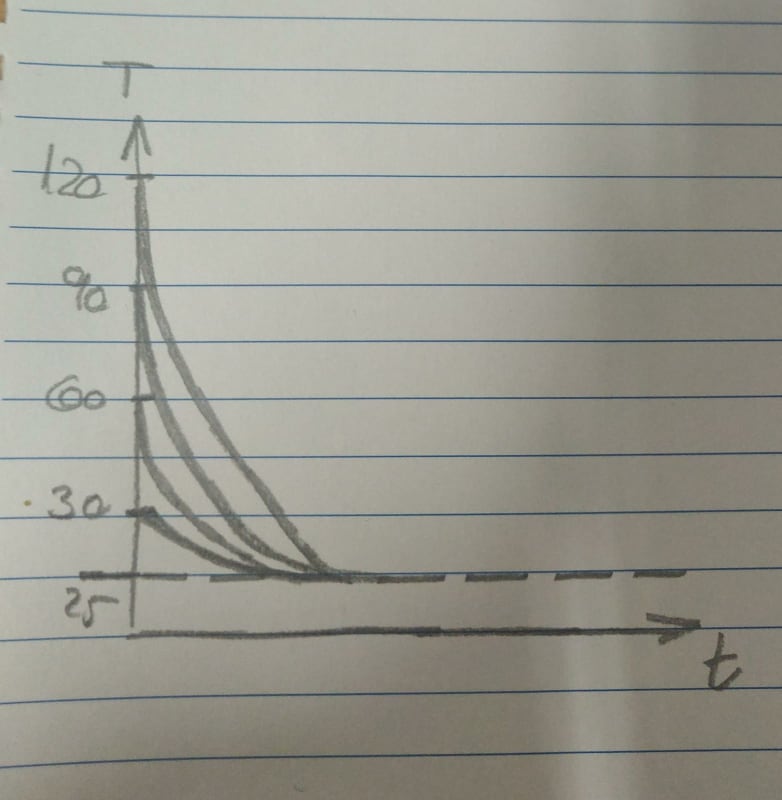
I want to check 5 different cases where the difference in each case is only the initial temperature.
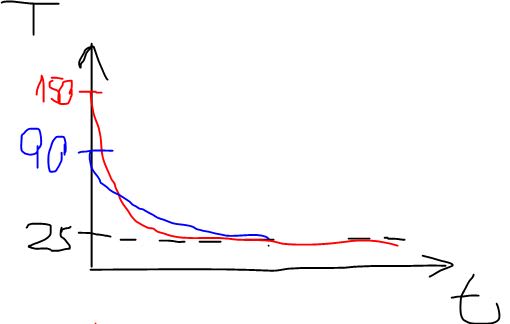
For example: 30 [c], 60 [c], 90[c], 120[c] and 150[c].
The final temperature is the same in all of the cases (25[c]), the physical properties don't change either.

1. I would expect that the higher the initial temperature is then the bigger the difference will be (30-25, 60-25, 90-25, etc) so it would take more time to cool. Is this a correct expectation? Is there a corelation(linear?) between the initial temperature and the time it will take?

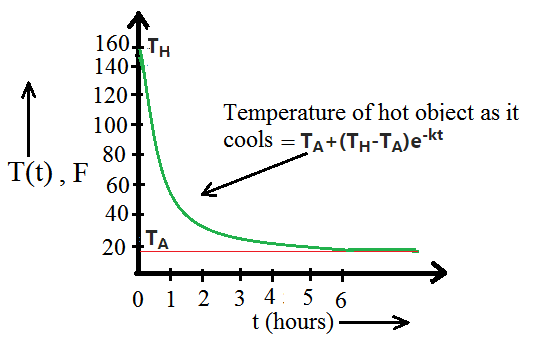
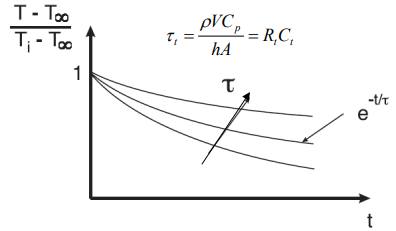
2. I know this equation for lumped systems.
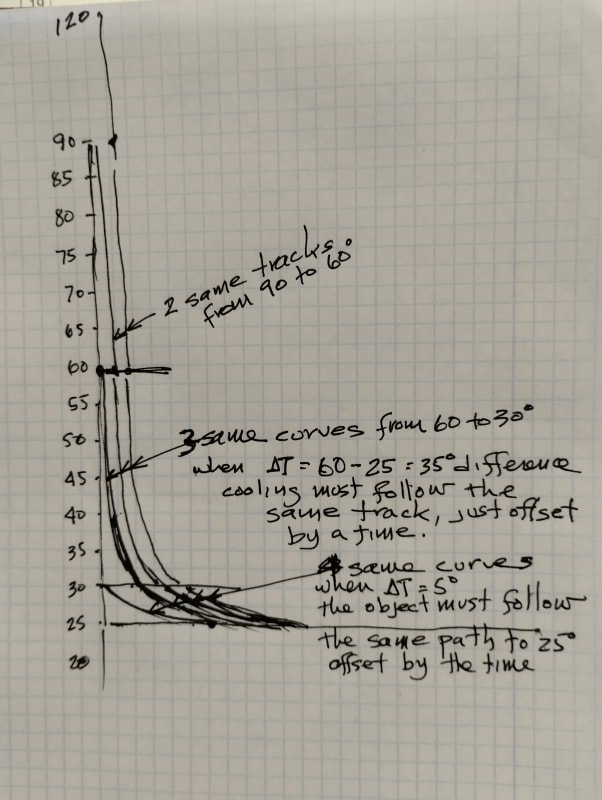
If I make graphs for the 5 cases and place them all on the same plot. Is there a way to compare them? The factor Tau is a constant and doesn't change. Tau isn't depending on the initial temperature, but the Y axis is.
On the other hand, this graph is normalized so that every graph starts from 1.
So how is it possible to compare the rate between the five cases?

Thanks in advance!

331970936_1560015454518976_3150370542833889554_n_ru0nab.jpg
 
Replies continue below

Recommended for you

Do not start with the normalised value of 1.
Start with the actual initial temperature in each case, then draw the curve above corresponding to the actual value of tau.

Each curve will be "parallel" but curves for higher initial temperatures will take a longer time to reach 25°C

See here,
Newton's law of cooling


--Einstein gave the same test to students every year. When asked why he would do something like that, "Because the answers had changed."
 
Thank you Petroleum for your reply.

1. In the link you provided its says: "The temperature difference between the body and the environment must be small". The differences as I mentiod are big (60C, 90C, 120C, 150C etc). So that might be relevant only for 30C.

2. I'm not sure what you offered:
The plot I attached is with different Tau factors, which means different materials. I asked what happens if the initial temperatures change (increse) but the other properties and materials are the same. What will happen in the plot of (T(t)-T_inf)/(T_i-T_inf) vs time when I put several graphs of different initial temperatures.

3. Q=q*A -> q=h(T-T_inf) -> as bigger the deltaT as bigger the q -> faster cooling. Right?
If so, then with the initial temperature of 120[C] I would expect to see faster cooling (to 25[C]) than for the initial temperature of 60[C]. But as you said: "for higher initial temperatures will take a longer time to reach 25°C". So i'm confused.

Thanks and sorry for my bad english :)
 
1. Yours are small ranges.
500C+ temperatures where things glow are where additional radiant energy loss become very important.

2. I told you. When material does not change, all the different curves you see in your diagram become the same curve and only the start temperature is different.
Higher temperatures only increase the length of the curve drawn from each temperature, because it takes a longer time to get to 25° when you start at 200° than if you start at 100°

3. It is a expn function.
The curves are representing the actual object's temperature at some time t during the experiment.
The faster temperature drops from the greater temperature variations only occur during the first few minutes. The temperature drops much quicker at first, when your object temperature is very high and the difference to 25° is great. Then as time passes, temperature drops becomes slower and slower as your object temperature drops closer and closer to 25°.


--Einstein gave the same test to students every year. When asked why he would do something like that, "Because the answers had changed."
 
nnn.png

Draw the same curve but start it at different temperatures.
Copy that exact same green curve and lower it straight down so it begins at the temperature you want to start with. If you start that curve at 100° it will hit 20° in about 2 hours, not 6.
At 6 hours the temperature might be -15°C if its environment temperature was that low.

At lower start temperatures it does not take so long to reach 20°C


--Einstein gave the same test to students every year. When asked why he would do something like that, "Because the answers had changed."
 
Thanks again Petroleum.

1. Understood. But can you please provide a link where its says that big difference is for 500C+? I'd like to read that (not that I have a doubt, just to read more about this topic).

2. To simplify things let's assume I have only 3 cases: 30C, 90C and 150C.
If I plot these 3 initial temps graphs in the same plot of Temperature vs Time then:
the graph of 150C should drop faster than the other two, and 90C will drop faster than the 30C but not faster than 150C.
In some point, the curvs will come together (where it will be? only when the temperature of all of them is 25[c]?)

If I plot these 3 initial temps graphs in the same plot of Normalised temperature(T(t)-T_inf)/(T_i-T_inf) vs Time:
The 3 graphs will be "parallel", so actually you'd see only 1 graph. However,the graph of 150C will be the longest and the 90C will be the shorter, but all the 3 will have exactly the same curve.
 
Heat Transfer is by processes conduction, convection and radiance.
If there is no visible heat radiation in terms of glowing color, its typically small enough not to worry about.

If there is not a large low temperature object in strong contact with the hot object, there is little to worry about with conduction.

Newton's law of cooling equation in our case models convective cooling, because the object is losing most of its heat to surrounding air, and we don't have significant radiance, or conduction (assumed).

Yes, they all come together at the ambient temperature, because then there is no more temperature difference to drive the convection process. Heating-Cooling stops.

On my graph they would be similar at big temperature differences, but still not exactly the same curves, because even at large temperature differences, the temperature difference between 160 and 20 and 150 and 20 do still differ by 10°, so they are not exactly equal there, and of course as you have realized their tails all must get flat at 20° if that is the temperature of the surroundings. If you reduced the surrounding temperature by the same amount as your initial temperatures between cases were decreasing, then the curves would be exactly equal everywhere. They would only have different start temperatures and different finishing temperatures.

This is pretty basic. but might help resolving the different processes involved,

There is tons of info on the Web if you search for "heat transfer process".

If you put a sheet of glass between the object and your hand and cannot feel and radiation passing through the glass reaching your hand, radiation will be small. A glowing fireplace will produce far more, yet probably most heat given off will still be from warming the surrounding air by convection.

--Einstein gave the same test to students every year. When asked why he would do something like that, "Because the answers had changed."
 
Still something is not clear for me:
If "they all come together at the ambient temperature" - then how the higher temperature drops faster?
(sorry for the bad drawing)
I mean - there are 2 points the graphs meat, but they all together only on the ambient temperature
one_jo28oa.jpg
 
The red line should always be above the blue. If not, there would be an error in the temperature reading, or calculation.

--Einstein gave the same test to students every year. When asked why he would do something like that, "Because the answers had changed."
 
Pretty close! Except they don't all reach 25" at the dame time. Stretch them out a bit. The 120 needs a little longer tail. The 120 drops faster at the beginning, but later will almost equal the others.
When the 120 hits 30, its tail afterwards should look like the 30 curve.
All should fit together like that.

When the 60 curve reaches 30°, from thereafter it should look like the 30 curve.
When the 90 hits 60°, it should look like the 60 curve thereafter.
When the 120 hits 90°, it should look like the 90 curve.

--Einstein gave the same test to students every year. When asked why he would do something like that, "Because the answers had changed."
 
Every cooling track is the same curve below any given temperature.
When the 120 gets to 90 deg, it follows the same path as the 90deg path to all temperatures below.
When the 90 gets to 60deg, it follows the same 60deg path to all temperatures below, which when it gets to 30 follows the same path for the 30deg track for all temperatures below 30.

1676832396274_f5bxpx.jpg


--Einstein gave the same test to students every year. When asked why he would do something like that, "Because the answers had changed."
 
As I understand it. Nonuniform heatup and associated time delay are considered throughout all points of the mass, whereas lumped mass treats all the mass as a uniform single point.

With a cube heated on one corner, the corner gets hot first, then time delay occurs as other points heat up. If heat is applied at a constant rate, eventually it arrives at some stable state. Thus the distribution of heat transfer within the mass becomes important and its thermal conductivity property must be considered, as opposed to lumped mass systems depends mostly on heat capacity, assuming that heat is applied uniformly to the entire mass at once. If you have two different objects with different heat capacities, Lumped mass would blend them into one object, probably using their average heat capacity.


--Einstein gave the same test to students every year. When asked why he would do something like that, "Because the answers had changed."
 
You'll have a different curve for every point in the object.
Temperature of any point is affected by the point next to it, not the ambient temperature as before. Only points on the surface of the object will be affected by the ambient temperature. How those points respond will affect points adjacent to them.


--Einstein gave the same test to students every year. When asked why he would do something like that, "Because the answers had changed."
 
Status
Not open for further replies.
Back
Top