Eng-Tips is the largest engineering community on the Internet

Intelligent Work Forums for Engineering Professionals

Mode Shapes calculated in Matlab Toolbox MACEC 3.3

Status
Not open for further replies.

E2015

Civil/Environmental
Apr 20, 2015
22
0
0
IE
Dear all,

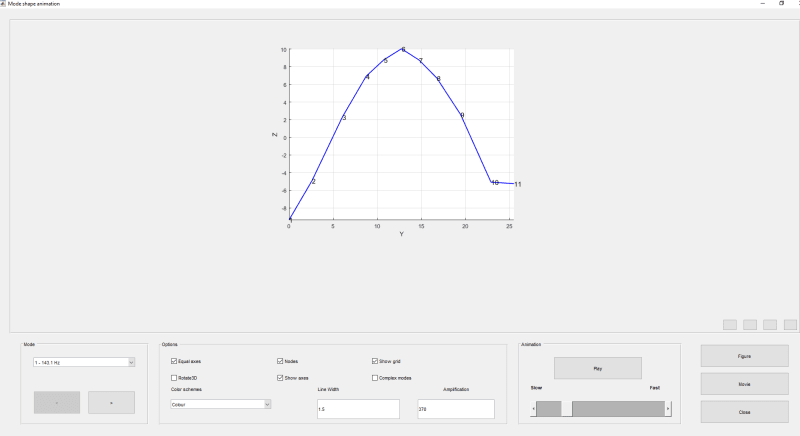
I am using Matlab Toolbox MACEC 3.3 for EMA of a railway sleeper (both concrete and timber).

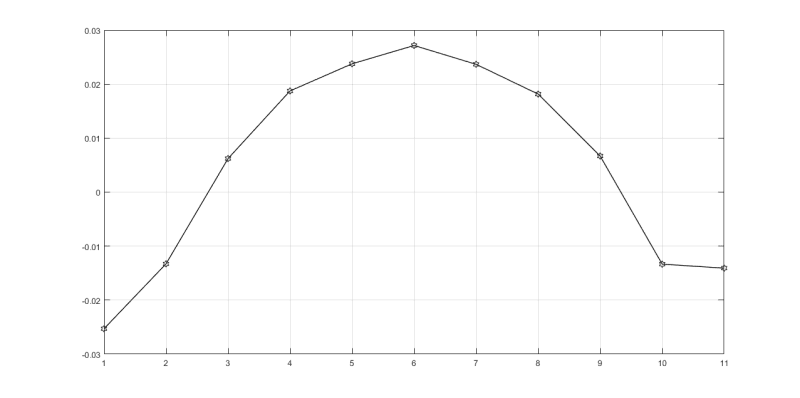
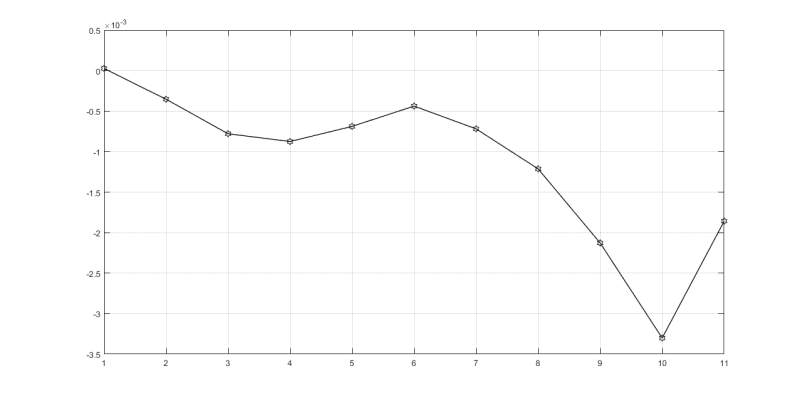
The resulting mode shapes I obtain are unity scaled modal mass mode shapes and they appear as complex numbers. For each mode calculated I also have information about Modal phase collinearities and Mean phases and mean phase deviations.

My question is following: How can I plot the mode shapes if they appear as complex numbers?

Many thanks,

Emina

Emina B.
 
Replies continue below

Recommended for you

Thank you for your reply.

Actually I can plot the mode shapes within the toolbox. The animation of the mode that I get within the toolbox looks like this:
Mode_Macec_rdvcro.png

However, I have to save the mode shape vector and plot it outside the toolbox environment. But in that case I don't know how to deal with modes that come as complex numbers.

I have followed your instruction: "I suppose the other option is to plot the real and imaginary deformed shapes separately"
and for the plotted mode in Macec I have calculated the real and imaginary part.

This is the plot of the imaginary part of the mode shape vector:
Mode_ImagPart_zxxjso.png


And this is the plot of the real part of the mode shapes vector:
Mode_RealPart_dupyfr.png


Does it mean from the above plots that I can actually use the plot of the imaginary part of the mode shape to represent the actual deformed shape?
And why the plot of the real part looks like this?
Is it common to get the deformed shape that is close to the actual deformed shape for that mode with the imaginary part instead of real part?

Many thanks,

Emina


Emina B.
 
Yes, in a normal modes analysis the resonance occurs at a 90 degree phase shift, so the imaginary part is the mode shape. In real life this occurs with simple systems such as a steel beam or plate. As you add complexities like point damping, clearances and so on then the phase plot vs frequency becomes much more complex, and the imaginary part of the response is not necessarily the important bit.

Cheers

Greg Locock


New here? Try reading these, they might help FAQ731-376
 
Status
Not open for further replies.
Back
Top