Been scratching my head far too long on this issue. I have a model of my campus chilled water district system in Pipe-Flo. Everything is currently modeled at the same elevation. When I generate the system curve vs. pump curve I get the following graph:
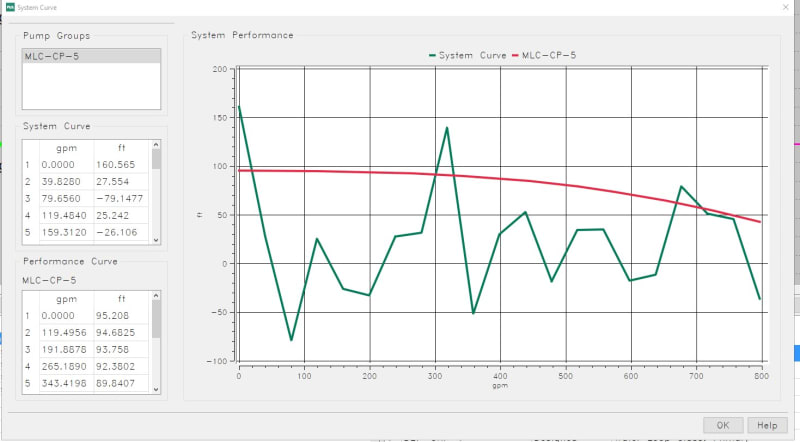
I've been reading in open system with static head inputs, it's possible to have a negative head with a positive flow at a point in the system (i.e. I assume suction force acting on a body of water). But this system is closed. I modeled each building with a fixed 10 dP device (which is not correct) flow control device (I believe this allows the variation of the Cv value to achieve the flow setpoint) and the MHRL (most hydraulically remote loop) I modeled by a fixed 0 dP (i.e. completely open control valve). Changed the 0 dP control valve to a positive value (e.g. 5 dP) did not change results.
Any thoughts on maybe why this is happening?
As a side-note, I noticed that the pipe friction factor (some dimensionless unit) on some pipes shows this semi-odd behavior:
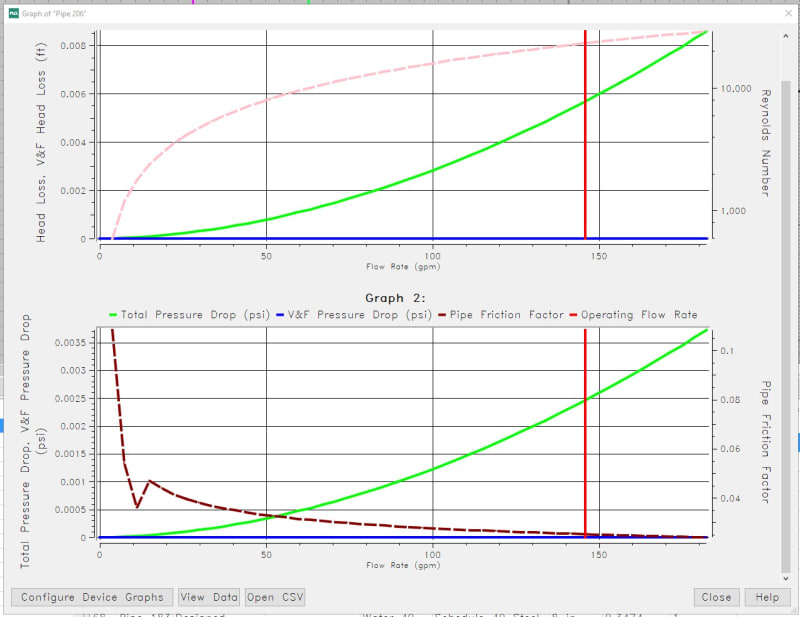
Without having dug into it further, the pipe friction factor seems to shows an odd spike at low flow values. Not a discontinuity by any means, but maybe this behavior is contributing to the odd pipe network analysis results.
I've been reading in open system with static head inputs, it's possible to have a negative head with a positive flow at a point in the system (i.e. I assume suction force acting on a body of water). But this system is closed. I modeled each building with a fixed 10 dP device (which is not correct) flow control device (I believe this allows the variation of the Cv value to achieve the flow setpoint) and the MHRL (most hydraulically remote loop) I modeled by a fixed 0 dP (i.e. completely open control valve). Changed the 0 dP control valve to a positive value (e.g. 5 dP) did not change results.
Any thoughts on maybe why this is happening?
As a side-note, I noticed that the pipe friction factor (some dimensionless unit) on some pipes shows this semi-odd behavior:
Without having dug into it further, the pipe friction factor seems to shows an odd spike at low flow values. Not a discontinuity by any means, but maybe this behavior is contributing to the odd pipe network analysis results.