Hi
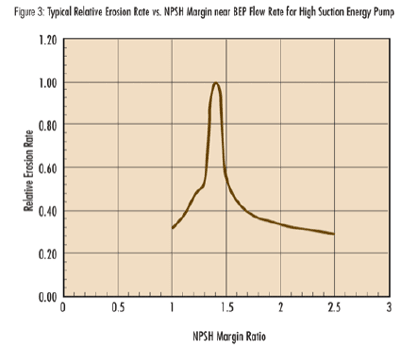
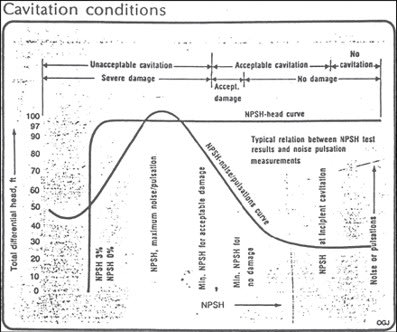
Several studies and authors have noted that peak impeller damage can happen around 1.5 to 2 X the NPSHR(3%) line. Mr Budris even managed to get that language into the 1998 version of ANSI 9.6.1.
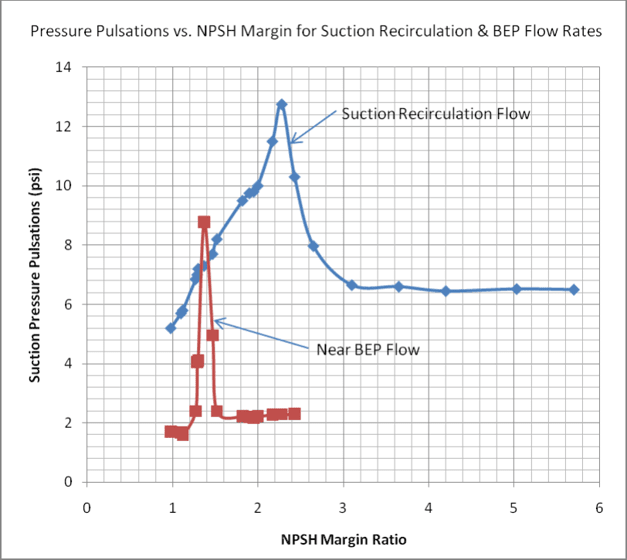
Peak erosion, peak noise, peak pulsations, all happen in this area. Once air starts coming out of solution as you approach a margin ratio of 1.0, noise drops, erosion drops and pulsations drop.
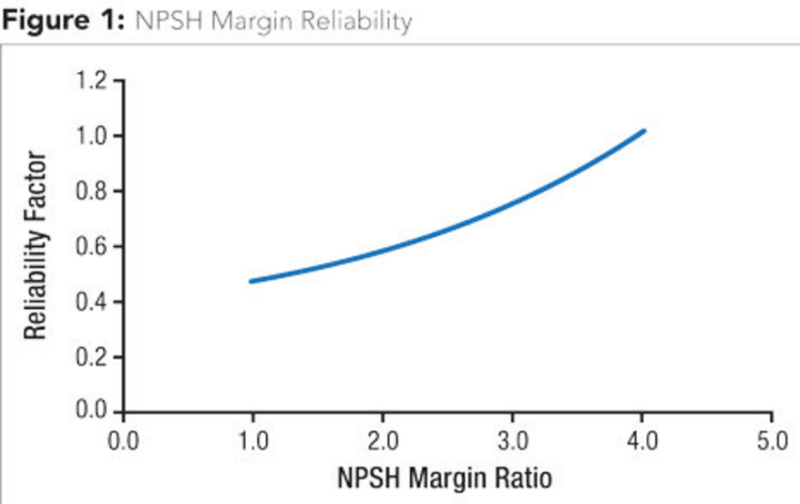
So I am struggling with the figure of NPSH Margin Ratio vs Reliability curve that Mr Budris has published many times. Why doesn't the reliability take a large drop near 1.5 to 2 X, and them come back up as you approach a ratio of 1.0.
It seems like the reliability curve should be an upside down version of the erosion curve, or the pulsation curve.
Several studies and authors have noted that peak impeller damage can happen around 1.5 to 2 X the NPSHR(3%) line. Mr Budris even managed to get that language into the 1998 version of ANSI 9.6.1.
Peak erosion, peak noise, peak pulsations, all happen in this area. Once air starts coming out of solution as you approach a margin ratio of 1.0, noise drops, erosion drops and pulsations drop.
So I am struggling with the figure of NPSH Margin Ratio vs Reliability curve that Mr Budris has published many times. Why doesn't the reliability take a large drop near 1.5 to 2 X, and them come back up as you approach a ratio of 1.0.
It seems like the reliability curve should be an upside down version of the erosion curve, or the pulsation curve.