Hi,
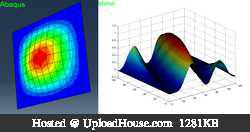
Could You help me with problem mentioned in the topic? I copied magnitude vector from eigenproblem results from Abaqus data [Link to data I used (second column - don't know what to do with rest)]. I have problem in reproducing results in Matlab. I am trying to draw normal modes in Matlab, but I haven't got much luck so far.
Code I used in Matlab:
(s is data imported from aforementioned .txt file)
z=s") ,2);zz=reshape(z,11,13);
,2);zz=reshape(z,11,13);
x= 0:10:120;y=0:10:100;[X,Y]=meshgrid(x,y);
y1=(0:1:100);x1=(0:1:120);
y1=y1';
zz2=interp2(X,Y,zz,x1,y1,'cubic');
[xx1,yy1]=meshgrid(x1,y1);
surf(xx1,yy1,zz2)
As You can see, the shape is completely different.
I would appreciate if you could help me what is wrong with my reasoning and show proper way to solve my problem.
All best regards,
Ian
Could You help me with problem mentioned in the topic? I copied magnitude vector from eigenproblem results from Abaqus data [Link to data I used (second column - don't know what to do with rest)]. I have problem in reproducing results in Matlab. I am trying to draw normal modes in Matlab, but I haven't got much luck so far.
Code I used in Matlab:
(s is data imported from aforementioned .txt file)
z=s
,2);zz=reshape(z,11,13);x= 0:10:120;y=0:10:100;[X,Y]=meshgrid(x,y);
y1=(0:1:100);x1=(0:1:120);
y1=y1';
zz2=interp2(X,Y,zz,x1,y1,'cubic');
[xx1,yy1]=meshgrid(x1,y1);
surf(xx1,yy1,zz2)
As You can see, the shape is completely different.
I would appreciate if you could help me what is wrong with my reasoning and show proper way to solve my problem.
All best regards,
Ian