PersonalProfile
Mechanical
Can you please advise why power stations in United Kingdom - GBR apparently historically had more cooling capacity, natural draft cooling towers, than Australia – AUS?
A summary of the justification for evaluating the cooling capacity of GBR as more than AUS follows:
I speculate that GBR does not have more "safety factor" for “cooling capacity” than the other countries, though this is the only obvious justification to me.
The relatively detailed justification follows.
I request due to interest only, and not to provide engineering services etc.
Thanks and regards.
Justification:
Benchmarking:
The following graph illustrates: Power (MW)/Cooling Tower, and Unit/Cooling Tower; versus location.
I focused on: AUS, and GBR; though also included:
Germany – DEU,
South Africa – ZAF, and
United States of America – USA.
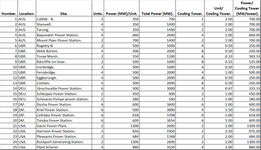
I interpret that GBR typically has the lowest Power (MW)/Cooling Tower with ~ 250 MW/Cooling Tower, compared to AUS with ~ 700 MW/Cooling Tower.
I assumed that the power stations all use the Rankine Cycle, and hence the rejected heat is “proportional” to the power.
The balance of the countries are generally more than GBR, though DEU’s increase is minor.

The graph is according to the following table, and the information was generally obtained from: Google Maps, and Wikipedia.

The cooling towers are apparently dimensionally similar with a base diameter of ~ 100 metres according to my measurements using Google maps.
“Calculations”:
I have not completed cooling tower calculations since university, however I roughly “calculate” according to the following chart for: AUS, and GBR.

The inputs, and justification, follows:
Water.
AUS.
Cooling tower: in/out: 40 °C/27 °C.
The temperature is according to historical data that I have for an AUS power station.
The evaluation assumes that the GBR cooling tower: in/out; temperature similar to AUS.
Air – inlet: wet bulb/dry bulb:
AUS: 23 °C/35 °C.
GBR: 19 °C/28 °C.
The ambient temperatures according to ASHRAE Annual Cooling – 0.4 %, data following.
I speculate that practically more effort is invested to ensure suitable properties, though I also speculate that this data is relatively proportional for “order of magnitude” comparison.
http://cms.ashrae.biz/weatherdata/STATIONS/037720_s.pdf
http://cms.ashrae.biz/weatherdata/STATIONS/943740_p.pdf
I speculate that the ability to transfer the heat in the natural draft cooling towers may be consideration, and is limited relatively according to the stack effect, refer following, that in summary is apparently proportional to the temperature difference, that apparently confirms that the GBR has increased capacity relative to AUS due to more temperature difference.
I did not attempt to complete any “calculations”.
https://en.wikipedia.org/wiki/Stack_effect
A summary of the justification for evaluating the cooling capacity of GBR as more than AUS follows:
- Benchmarking: I interpret that GBR typically has the lowest — ~35 % of AUS, Power (MW)/Cooling Tower with ~ 250 MW/Cooling Tower, compared to AUS with ~ 700 MW/Cooling Tower, and
- “Calculations”: I “calculate” that GBR’s has significantly more, ~50 %, cooling capacity with increase of specific heat capacity of ~30 kJ/kg, compared to AUS’s ~20 kJ/kg.
I speculate that GBR does not have more "safety factor" for “cooling capacity” than the other countries, though this is the only obvious justification to me.
The relatively detailed justification follows.
I request due to interest only, and not to provide engineering services etc.
Thanks and regards.
Justification:
Benchmarking:
The following graph illustrates: Power (MW)/Cooling Tower, and Unit/Cooling Tower; versus location.
I focused on: AUS, and GBR; though also included:
Germany – DEU,
South Africa – ZAF, and
United States of America – USA.
I interpret that GBR typically has the lowest Power (MW)/Cooling Tower with ~ 250 MW/Cooling Tower, compared to AUS with ~ 700 MW/Cooling Tower.
I assumed that the power stations all use the Rankine Cycle, and hence the rejected heat is “proportional” to the power.
The balance of the countries are generally more than GBR, though DEU’s increase is minor.

The graph is according to the following table, and the information was generally obtained from: Google Maps, and Wikipedia.

The cooling towers are apparently dimensionally similar with a base diameter of ~ 100 metres according to my measurements using Google maps.
“Calculations”:
I have not completed cooling tower calculations since university, however I roughly “calculate” according to the following chart for: AUS, and GBR.

The inputs, and justification, follows:
Water.
AUS.
Cooling tower: in/out: 40 °C/27 °C.
The temperature is according to historical data that I have for an AUS power station.
The evaluation assumes that the GBR cooling tower: in/out; temperature similar to AUS.
Air – inlet: wet bulb/dry bulb:
AUS: 23 °C/35 °C.
GBR: 19 °C/28 °C.
The ambient temperatures according to ASHRAE Annual Cooling – 0.4 %, data following.
I speculate that practically more effort is invested to ensure suitable properties, though I also speculate that this data is relatively proportional for “order of magnitude” comparison.
http://cms.ashrae.biz/weatherdata/STATIONS/037720_s.pdf
http://cms.ashrae.biz/weatherdata/STATIONS/943740_p.pdf
I speculate that the ability to transfer the heat in the natural draft cooling towers may be consideration, and is limited relatively according to the stack effect, refer following, that in summary is apparently proportional to the temperature difference, that apparently confirms that the GBR has increased capacity relative to AUS due to more temperature difference.
I did not attempt to complete any “calculations”.
https://en.wikipedia.org/wiki/Stack_effect

