Eng-Tips is the largest engineering community on the Internet

Intelligent Work Forums for Engineering Professionals

  • Congratulations waross on being selected by the Tek-Tips community for having the most helpful posts in the forums last week. Way to Go!

Preconsolidation Stress based on Oedometer Test and Undrained Shear Strength

Status
Not open for further replies.

TimesNewRoman

Civil/Environmental
Jul 27, 2018
4
0
0
RS
Dear All,

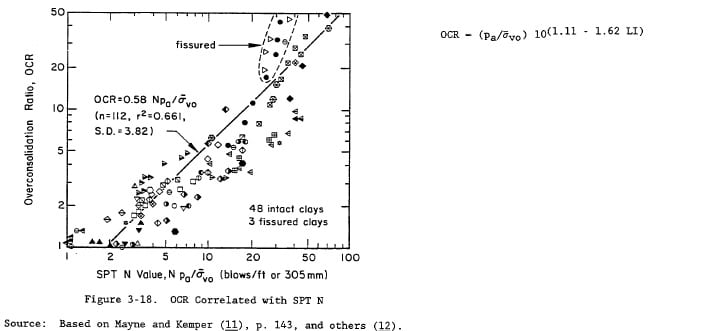
We are dealing with a flat field containing clay and silt with occasional beds of sand (1-2m thickness). The SPT counts from depth 10m to 30m vary from 30-50. No SPT value is less than 30! GWT is at depth 3m from ground surface. Moisture content is around 20% and LL = 45-55.

I have received a couple of oedometer and unconfined compression test results from a local laboratory.

They performed oedometer testing at 2 fine grained soil samples.

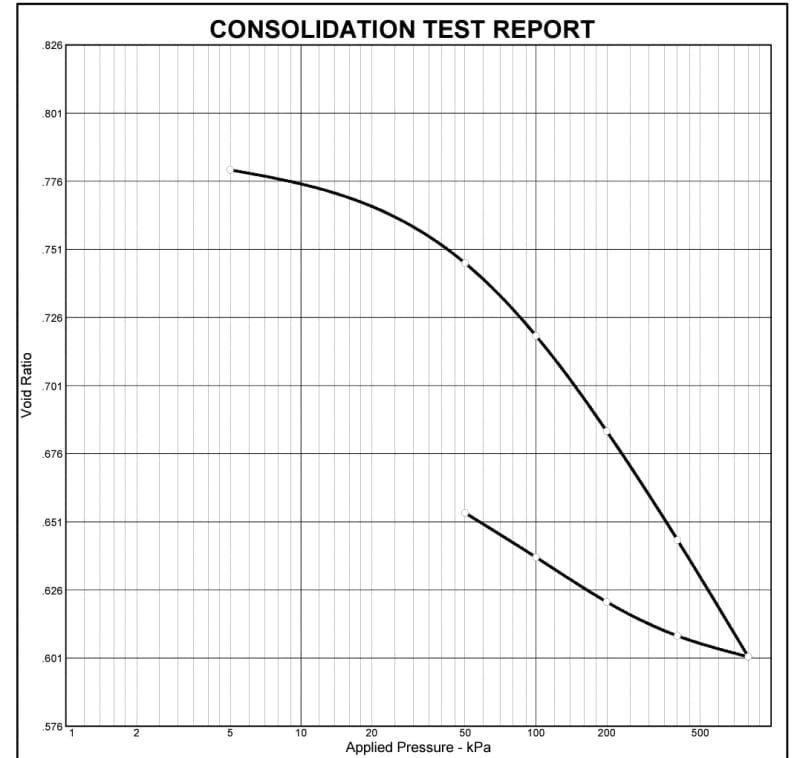
Sample 1. Depth 17m. Pc = 142 kPa. This means that OCR<1
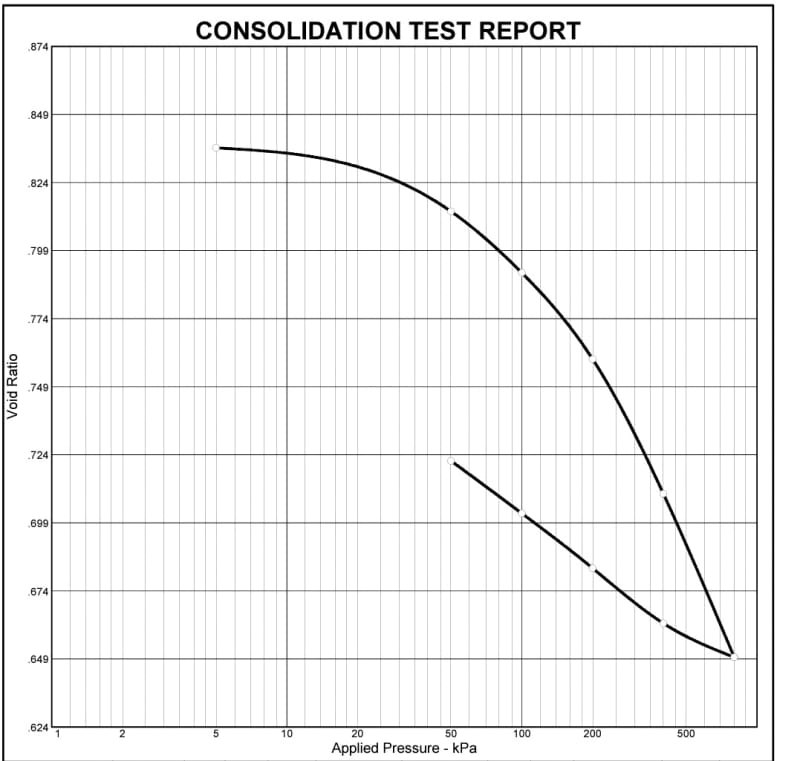
Sample 2. Depth 23m. Pc = 160 kPa. This means that OCR<1

They also performed Unconfined Compression test at:

Sample 1. Depth 15m. Su = 180 kPa.
Sample 2. Depth 25m. Su = 300 kPa.

I can not wrap my head around how low the presented Pc values are. The SPT counts seem high. If we use the Su/p' equation, it tells me that the material is overconsolidated, I can estimate a Pc of 700-900 kPa (Su x 4 or 5).

Should I trust the oedometer test? I can clearly see the linear curve, the estimation of Pc seems correct based on the void ratio vs pressure curve.
My instinct tells me to use OCR > 1 based on Su and SPT values.

Did any of you have such a dilemma? I'd appreciate if you can help me with your experience.

Best Regards,
 
Replies continue below

Recommended for you

here are the curves.

Screenshot_20181211-173432__01_lxpljq.jpg


Screenshot_20181211-173318__01_btvbpf.jpg


edit: natural moisture content is around 20% and LL = 45-55.
 
The samples appear very disturbed, based on a comparison with the in situ void ratio. Where is the water table? Are these saturated? What is the in situ effective vertical stress?

Assuming in situ effective vertical stress = 10*depth, I'm not sure how p'[sub]c[/sub] can be interpreted reliably.

To be honest, these look like they would be okay tests if they were from a shallower depth. But for the depths you've got, they don't appear reliable to me.

Could there be a legitimate reason for underconsolidation (e.g. rapid deposition)?

 
yes, the curves don't make sense.

The soil is overconsolidated as the Wn is much less than the LL.

Even when I squint, I can't get to 142 kPa for the Pc of the first curve!

f-d

ípapß gordo ainÆt no madre flaca!
 
LRJ,

The GWT is at 3m from ground surface(water found at a sand layer with thickness of about 4m). Yes, the test was performed in saturated samples.

The in situ vertical stress for the sample at 15m is 180 kPa, for the sample at 23m is 260 kPa.

I can not see a legitimate reason for underconsolidation, especially taking into account the N spt counts.

Fattdad, I understand you compare Wn to LL (ive seen you mention this in many other posts) to get an idea of the OCR. Does the SPT count tell you anything regarding OCR?

I just checked the oedometer readings, and it seems that both samples were in expansion until they were loaded with 200 kPa. Could this be the reason? Maybe they should have tested the sample with larger loads? I can't see how the sample was disturbed considering the unit weight is 20 kN/m3. I've had cases where ive seen oedometer tests on remolded samples to the in situ density.
 
In the world of general behavior, we could consider an Su/P ratio of 0.2 or 0.25. If you have an in-situ sigmaV=180 kPa, that'd suggest an undrained shear strength of 36 kPa (750 psf). An undrained shear strength of 750 psf equates to an unconfined compressive strength of 0.75 tsf. Correlations to N-values suggest that soils with an UCS=0.75 would return N-values of 5 to 8. You are showing N-values of 30 to 50. USC of soils with N-values of 30 to 50 are shown as, "Greater than 4tsf." What accounts for the difference in strength from SHANSEP's Su/P value of 0.2 or 0.25? Overconsolidation. . . stress history. How much OCR? Who knows, but. . . it seems like it could be like an OCR of 4 or better?

Then again, you don't really have the lab support and N-value correlations to undrained shear strength are pretty inaccurate. That said, I'm thinking it's overconsolidated!

f-d

ípapß gordo ainÆt no madre flaca!
 
Based on the SPT values your clay is overconsolidated. You can also try the index testing correlation from liquidity index.

OCR_sotqll.jpg


The first stage of site investigation is desktop and it informs the engineer of the anticipated subsurface conditions. By precluding the site investigation the design engineer cannot accept any responsibility for providing a safe and economical design.
 
There is also something not adding up in the data you provided with void ratio and a natural moisture content. A saturated clay of 20% doesn't seem right unless its heavily over consolidated, a 20% moisture content I would assume its a silty sand at best, nevertheless

Se = Gw assuming G = 2.7 and saturated
e= 0.54

Your consolidation test report are up in the 0.7 range something is wrong. Using common sense a low moisture content, high blow counts, and it looks like a clay it must be over consolidated.

Its either your consolidation test is wrong or your moisture content is wrong or its not fully saturated or you did the blow counts wrong or with a reduced hammer weight.

The first stage of site investigation is desktop and it informs the engineer of the anticipated subsurface conditions. By precluding the site investigation the design engineer cannot accept any responsibility for providing a safe and economical design.
 
Status
Not open for further replies.
Back
Top