Eng-Tips is the largest engineering community on the Internet

Intelligent Work Forums for Engineering Professionals

Pressure gradient in a low pressure, low flow, dry, natural gas well 2

Status
Not open for further replies.

bcavender

Electrical
May 31, 2018
98
0
0
US
A natural gas well with a 6.25" bore was gauged at 45 psig after 20+ years of being shut in.

For eight years, an estimated 101.1MCF has been delivered to the burner tip annually.
(An average daily draw of 277 SCFD is based upon a meter installed last year to capture total & summer=200/winter=355 SCFD variation).
There has been zero water collected in the drip and there have been no freeze off problems.

There is no pressure data available for the first four years.
For the past four years, wellhead pressure has stabilized at 30 psig, plus or minus 1.25 psig winter to summer.
So it appears that the flow through the formation has achieved an annualized, steady state and the surrounding formation could reasonably assumed
to be cylindrical with sufficient surrounding pressure to sustain this small flow. (fully realizing the uncertainty, but having no better information to suggest another)
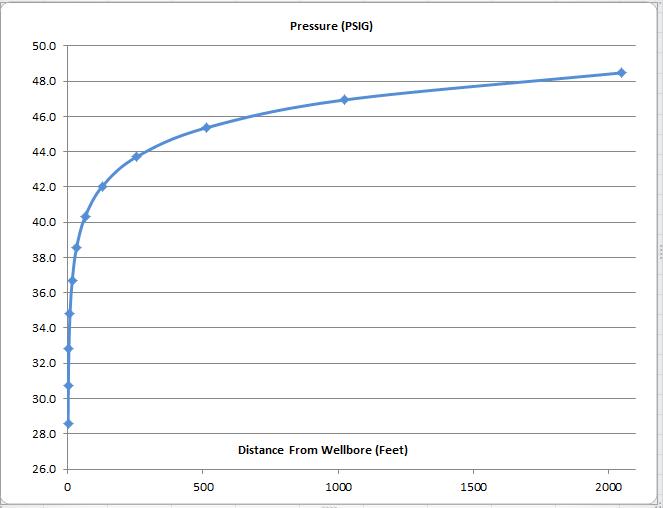
Since there are no other wells in the formation within two miles and no known production in the region, it seems possible that at some reasonable radius back from the bore, the pressure should approach the original 45 psig, long period, shut in pressure.

The reason for the calculation is to get a feel for the sustainability/value of the well. The confidence and value to the owner would be much higher if it was known that the rock pressure depletion radius extends only 50 feet rather than 500 feet or more. A calculation or windage estimate with an accuracy level in the 20-30% range would be quite satisfactory over no current information at all.

What calculation should I use to get near to what this radius is likely to be?

Further formation data as can be best determined:

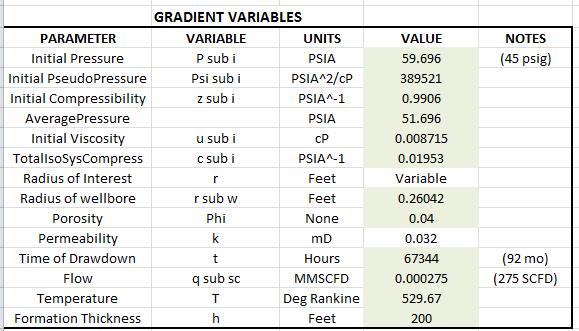
height of formation = 200' (Well report)
description - Top of the Ordovician Knox, tan, sucrosic dolomite (Well report)
porosity = 4% (Drill log)
temperature = 73 degF (Drill log)
permeability = 3.5 mD (Conservative estimate from regional historical records ranging 0.5 to 10mD)

All suggestions and comments are appreciated!
Best regards,
B


Replies continue below

Recommended for you

After a couple weeks of searching, then reading the "Gas Well Testing Handbook" by Amanat U. Chaudhry (Excellent Practical Text),
the preferred method for calculating formation pressure at a distance includes significant correction for viscosity and compressibility via the use of a "pseudopressure" method. From the text, it appears that this correction process is applicable for all cases ... or at least I haven't yet run into where it would not be applicable.

Conveniently Chaudhry includes a spreadsheet for calculating PseudoPressure from atmosphere through 4000 paia. Plotting Chaudhry's PseudoPressure points for this problem up to 140 PSIA looks like:

PseudoP_psltsc.jpg


A sample computation of formation pressure at a radial distance looks like:
PressAtRadiusCalc_mkcvur.jpg


All of the parameters in his example are nicely defined down to practical units, however c sub i = 0.00055 psia^-1 appears to be a form of compressibility, but I cannot find any definition of this parameter or anything remotely that looks like it in any of the searchable literature. Since his example is two orders of magnitude higher in pressure, most likely this c number isn't applicable here. It looks like the last parameter I need to be able to compute the radius pressure.

Can anyone offer what this c sub i variable is actually defined as in practical terms?

(And offer any other comments about my application of this particular methodology.)

Thank you!
Best Regards,
B
 
Good work!

It's the gas compressibility
Rough estimate using the compressibility of an isothermal gas, I suppose the "[sub]i[/sub]" means isothermal.
P1 V1 = P2 V2
2000 psia x 1 any cubic volume = 2001 psia x V2
V2 = 2000/ 2001 = 0.9995 any cubic volume

Compressibility = ΔV/ΔP = (1-0.9995)/1 psia = 0.0005/psia

Including the natural gas compressibility factor z, I estimate as z = 0.85 to 0.9 at well bottom P & T.
Ci = 0.0005 / 0.9 = 0.00055


A black swan to a turkey is a white swan to the butcher ... and to Boeing.
 
1503,

Thank you for your response!

It makes sense that the z compressibility factor gets computed at each pseudopressure point. I was getting tripped up seeing compressibility used in there twice.

I had read somewhere that c sub i was the ‘Total System Isothermal Compressibility”, but I couldn’t nail down a hard definition of what that actually meant and how it is supposed to be practically calculated.

The ratios of the deltas clears that up the C question perfectly. Thank you!!!

The thing that I am unclear about is should the Compressibility best be calculated using the drawn down wellbore bottom pressure, initial pressure before drawdown or maybe the average?

(Seeing the magnitude of the numbers, likely C sub i is not going to have a super big impact anyway.)

But the best part for me is taking away the uncertainty about the validity of the calculation.

Thank you very much for that!

I need to get in gear and run the graph.

Thank you!

Best regards,
B
 
I think using the average value is intended, but this link gives a clear picture of what the pseudopressure method is doing and seems to offer a means of checking if the results are accurate.
All the Penn State courses are very complete with many subjects on offer. I've been a subscriber (free) for a long time.
Heres an online calculator for natural gas compressibility factor (not compressibility) with the possibility of easily entering some typical associated gases. Could be useful.

A black swan to a turkey is a white swan to the butcher ... and to Boeing.
 
C sub i grew up near 0.01953 using 51.7psia as the range to compute it as you did. So it was a little more significant than I expected, but looks like a logical number.
I have no information on Permeability so being that was all that was left, I had to crank it way down to 32 microdarcies to get the wellbore pressure down to the measured value of 28.5 psig.
As a first look into what the pressure gradient could be, it didn't look all that bad.

HPG22622_ibcjdd.jpg

The only really odd part about the curve was the gradient rose three psig above the shut in InitialPressure which clearly shouldn't be-unless gauge errors are lining up against me.

Looking back over the handbook, tsubD/rsubD^2 is required to be over 25. Based on that, radii 64' and higher fall below 25 and appear questionable which might explain the pressure plotting > 45.
HGC2222022_bda2nv.jpg


RatioGthan25_bxdvc1.jpg


The questions in my mind, is there a different set of calculation rules when this ratio goes under 25 or are we at the point of diminishing returns for calculation effort ... and does 32 microdarcies seem reasonably in the ballpark since we are talking such a low flow (275 SCFD in 200 feet of formation-no detail on any packers installed)?

HGV2222022_cuncnc.jpg


I appreciate your thoughts!!!
B
 
32 MicroDarcys? = 32/1-E6 D 32mmD, calc shows 0.032, so its mD, miliDarcys.
A Porosity of 0.04 could indicate a permeability as low as 0.10 mD

Is this a coalbed type formation?
What depth is this producing from?
Gas specific gravity?

A black swan to a turkey is a white swan to the butcher ... and to Boeing.
 
The k value in the original sample calculation from the Well Testing Handbook was 20 milliDarcy. That looked pretty common so that set my expectation range for k.

We’ve not run an analysis on the gas for SG, but I might be able to get a better ballpark number from another Knox well. Good point, I’ll snoop into that next or maybe pony up to get it run. I could see that being off by 0.5 and I have no idea about the sensitivity that has on the pseudo pressures. Might be a big deal I’ve overlooked.

With the other values reasonably pegged, I started iterating the spreadsheet for a k value to drive the wellbore calculated pressure down into the range the gauge was reading, I had to go well below 1 milliDarcy, eventually getting to 0.032 milliDarcy. That made me doubt what I was seeing since in all the well testing lit I had seen 0.1 milliDarcy appeared to be the absolute bottom level of ugly for a commercial k.

The well is drilled into to top 200’ of the Ordovician Knox dolomite (no coal) at about 1600’ TD which stretches down about 2-3000’ further. From the scarce info I have dug up pouring over old geology pdfs, the worst perm was supposed to be about 0.5 milliDarcy up to about 10mD. That was what raised my red flag when I had to iterate k down to 0.032 mD in the spreadsheet to get the bore pressure to match what I see in the field. I’ve double checked the spreadsheet formula a couple three times, but since k still looks two orders of magnitude low and the outer radius of the gradient pressure goes higher than the original, long term (decade+) shut in value, it makes me doubt that I have performed the calculation correctly because of my lack of training/experience.

Since to last post, I was able to lay hands on the well’s production history. At 45psi (driller completion), the well produced for five years, with a first year peak production of 911 MCF and later taken off line at around 200. Around 25 yr later (no intermediate data), the shut in pressure was fully back to 45 psig. So it appears the bottle is getting refilled, but that takes me back to the original question of what’s the radius gradient to roughly estimate the gas in place and maybe estimate how fast it is refilling?

The prod data now raises the question if it’s even possible that nearly a MMSCF/yr could have permeated k=0.032 mD in the 30-40 psi drive range … or about 2.5 MCFD on average … making the k=0.032mD feasible or fubar?

This has been quite a challenging detective and learning experience. Interesting field. Getting to a reasonable conclusion seems nearly within grasp … and I can see why you guys get paid the big bucks.

 
Thanks for the info. .1 mD'Arcy is fracking territory, but nobody is going to do that unless there is potential to bump that flow rate by 100 or better yet 1000X.

In regard to the formula to use in relation to T[sub]D[/sub]/R[sub]D[/sub]^2
There are 3 ranges that each use different formulas

Page 37 Example 2-6 And in Page 40 Example 2-7 Page 41
ΔPd is calculated using T[sub]D[/sub]/R[sub]D[/sub]^2 value >25 with eq 2-63 and 2-65 as seen on Page 35 and 37 are accompanied by other formulas for P[sub]D[/sub]
when
T[sub]D[/sub]/R[sub]D[/sub]^2 >25 and
Eq 2-59a for when T[sub]D[/sub]/R[sub]D[/sub]^2 > 4 T[sub]D[/sub]/R[sub]D[/sub]^2
And 2-61 at the borehole

Note that on page 38 the Example uses the "pressure treatment" method". Page 39 gets into the "pressure squared treatment" with the same results and then page 40 shows the "pseudopressure treatment" using equation 2-65, for >25. Then, again with the pseudopressure treatment", Example 2-7 uses eq 2-63

I dont yet know what that does to your calculations, but it might be worth some effort checking into that.

BTW, full disclosure: I'm not a geologist/petroleum engineer. I've done pipeline designs for the last 40+yrs, 5yrs in a Laredo gas field with 800 wells in tight limestone, way back in the 80s and only managed to learn a little bit about this by looking over the petrol engineer's shoulder. And that was a long time ago, but I'm entertained looking back into it with you. Hope you're not too disappointed finding that out.

A black swan to a turkey is a white swan to the butcher ... and to Boeing.
 
 https://files.engineering.com/getfile.aspx?folder=74a2cdf7-893e-4eea-aa62-fc364eea5314&file=Fluid_Flow_Equations_for_Gas_wells.pdf
TdRd_t8jdr0.jpg


Looking at the references still have me scratching my head. Basically it appears that the two formulae's conditions for use are effectively the same since (02-59a) just has both sides of the inequality multiplied by a factor of four. For the same r, the true/false tests of the inequalities evaluate identically. Or am I just missing something really badly?

I will have to review the use of P, P^2 and Pseudo methods. From everything I read, the PseudoPressure method worked for all pressure ranges ... but clearly the t subD/r subD^2 > 25 gotcha seems to leave loose ends even with Pseudo method. Since this gotcha seems coincident with the distant pressures being too high, I'd bet two rounds of beer that the discrepancy lies near there. Interestingly, I just ran the same spreadsheet for another well at about four times the pressure and it has the same less-than-25 problem for the gradient. He's doing a drawdown test and I am going to try computing his k. That will be interesting.

Shirley the big PE boys don't screw around with these gotcha formulae every time they are cranking out their well test work. This makes me wonder if some pro well test software has a workaround for this already in the can? Finding someone that could drop these numbers in a pro package might be the way to move to running the numbers correctly. When the ratio of r sub e/bore radius stars getting way up there, the formation pressure should be approaching the P sub i initial pressure ... not zooming above it.

I was able to chase down a SG from a relatively nearby well which came to 0.655 vs the 0.7 in my first run. Made a smidge of difference, but didn't affect the pressure far away from the wellbore coming out higher than the original, long time shut in pressure. Going software searching ...

This is more of an academic/practical engineering adventure on my part vs making money, but I find it is an immense pleasure to tackle a really tough problem and whip it. Keeps the neurons firing.

On the absolute contrary, I am delighted that you are interacting here.

You were far closer to the action and have been a big help for my learning game. While I worked for an interstate pipeline for 31 yr, I was mostly involved in control systems/SCADA/networking. One of the most interesting projects that I was able to pickup a tiny bit of reservoir knowledge from was the automation of a major gas storage reservoir. It covered about 20mi x 25mi area holding a 30' ocean sand layer trapped between two impermeable layers. Originally it took about 110 yrs to fully produce. When regional line capacity fell well below demand, the pipe put in a really large compressor station that could fill/empty about 2/3rds of that total volume every winter. Water and freeze offs at those hefty flows would kill about 25% of the deliverability and roving crews couldn't find enough of them in time to make a difference. We ended up putting orifice measurement/telemetry on 450 wells and paid for it first year in savings by not having to buy off-system (2x-3x more expensive) gas. Cut the crew labor by 2/3rds ... and they were happy to be free of the freezing crap work. LOL ... those were heady days kicking butt and getting stuff done.

Part of me misses the challenge, but the narcissistic psychopaths that parachuted into the tops of all the corps (and know less than zero about the inner workings) made the pain of even being there too much. After I left, the dumb dufus deal white shoe boyz sold the company off to TransCanada (who is even further removed from the action and can't seem to do anything but cut the denominator. The men a generation before me, who conceived, capitalized and drove the 36" lines across swamp and mountaintops, would curse the air they breathe because they are destroying a valuable, necessity infrastructure for which there is no current replacement. Frankly, I see some real systemic bulk energy problems coming that are going to cost peoples' lives ... and it didn't need to be that way.

Probably coming sooner than later sad to say.
 
Yes, the pseudo method is supposed to be valid over the full range. I just thought it might be interesting to look at the others as well.

So far I think the differences are due to the permeabilities or the particular well characteristics, skin factors and other fudge factors, water and perhaps the scale factor, the flow being so small.


A black swan to a turkey is a white swan to the butcher ... and to Boeing.
 
Status
Not open for further replies.
Back
Top