Greetings,
I'm doing wave propagation analysis of a beam by applying a harmonic load at one end of the beam whilst holding it fixed against a wall (cantilever beam) with rolling supports applied at surfaces other than loading surface. The image illustrates my project:
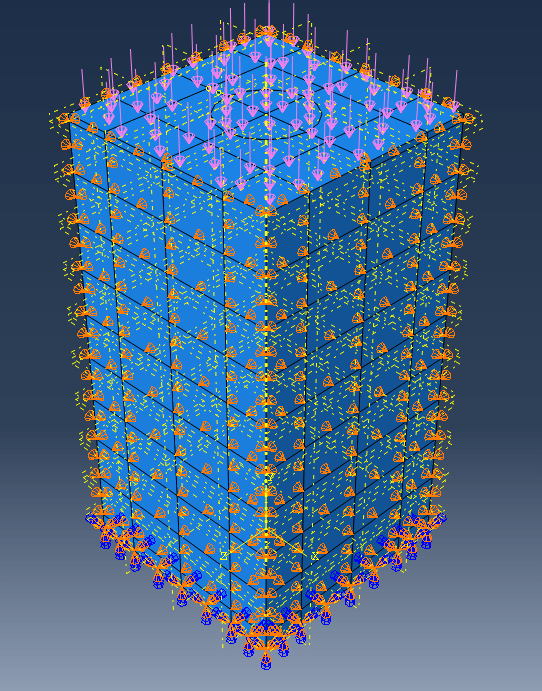
In doing so, I'm trying to investigate stress plots along the length of the composite at particular nodes and obtain reaction force for the set named "fix". I have done the following so far:
a) Create three nodal sets at varying heights: starting from the edge of the fibre till the boundary of the matrix. And created a reaction set for the fixed end.
b) Create history output using sets and appropriate variables. In this case I created "reaction force" and "s22 for the nodal sets", for evenly timed intervals of 2000.
However when I look at the History output variables i get loads of variables! It is something like this:
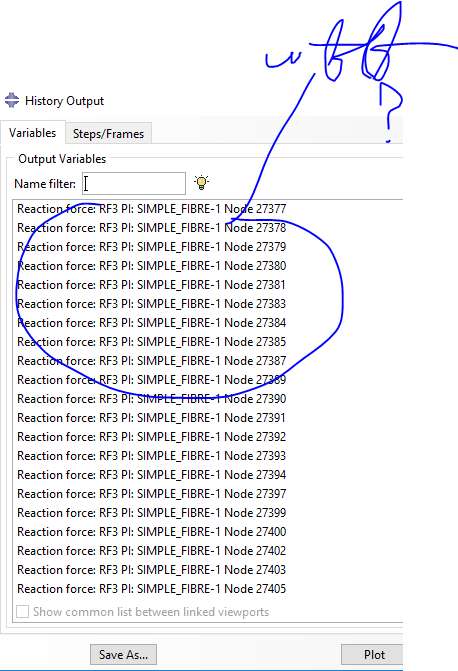
In the figure above I can't even find most of my nodes in the node set created before post-processing.
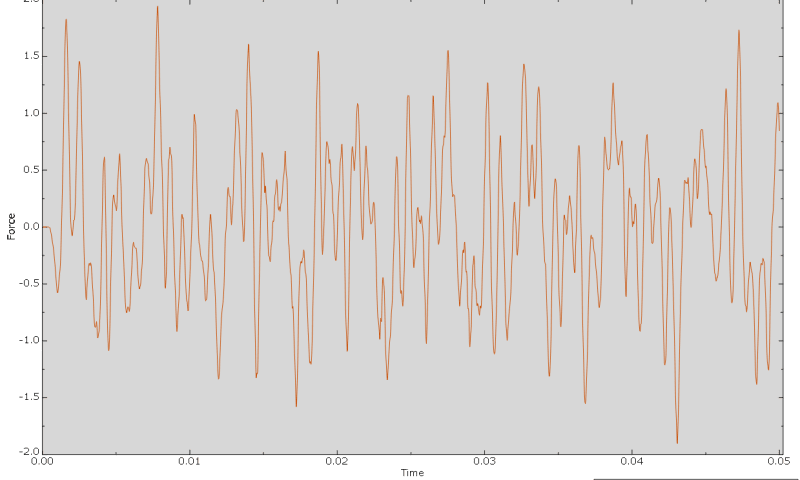
I have only two steps: initial and pulse load, when I try to plot using history output I seem to only get one plot, would someone mind explaining what this plot actually represents (maybe reaction force as it says)?
My supervisor for this dissertation doesn't seem to like the fact that I can use field output to convey my results and he seems adamant on this matter so I am kind of forced to use history output (at the moment trying to work with element sets). If i were to use field output I would've been done for my results weeks ago! Time is of essence.
I'm doing wave propagation analysis of a beam by applying a harmonic load at one end of the beam whilst holding it fixed against a wall (cantilever beam) with rolling supports applied at surfaces other than loading surface. The image illustrates my project:
In doing so, I'm trying to investigate stress plots along the length of the composite at particular nodes and obtain reaction force for the set named "fix". I have done the following so far:
a) Create three nodal sets at varying heights: starting from the edge of the fibre till the boundary of the matrix. And created a reaction set for the fixed end.
b) Create history output using sets and appropriate variables. In this case I created "reaction force" and "s22 for the nodal sets", for evenly timed intervals of 2000.
However when I look at the History output variables i get loads of variables! It is something like this:
In the figure above I can't even find most of my nodes in the node set created before post-processing.
I have only two steps: initial and pulse load, when I try to plot using history output I seem to only get one plot, would someone mind explaining what this plot actually represents (maybe reaction force as it says)?
My supervisor for this dissertation doesn't seem to like the fact that I can use field output to convey my results and he seems adamant on this matter so I am kind of forced to use history output (at the moment trying to work with element sets). If i were to use field output I would've been done for my results weeks ago! Time is of essence.