Eng-Tips is the largest engineering community on the Internet

Intelligent Work Forums for Engineering Professionals

Problem with Intrapolation for factor A

Status
Not open for further replies.

AliGrailly

Mechanical
Dec 8, 2020
72
0
0
IR
geometric-chart-for-component-under-external-loading_tyx2el.png


Hi friends

Could you explain plz how to get factor A 0.00140 in above figure?
 
Replies continue below

Recommended for you

Just a little bit to the right of the blue line?

Looks like you're right at the interesting point where a small change in one axis makes a big difference in the other axis

Remember - More details = better answers
Also: If you get a response it's polite to respond to it.
 
@LittleInch hi

Distance between vertical lines after 0.0001 and 2 is 0.5 Or 0.25 ? Some vertical lines is not same in length but add 1 , some lines is not same in L between them but also add 1 unit

Is there in Asme code mentioned in specified table this values fir factor b like exemption impact testing at temp in b31.3 tabulated
 
The vertical line at 0.001, just to the right of 0.0009 is exactly that - 0.001

The next line to the right is 0.0015

Then 0.002

Then 0.0025

then 0.003
then 0.004 ...

don't know about your second point

Remember - More details = better answers
Also: If you get a response it's polite to respond to it.
 

Thanks but So very difficult intrapolate for me , i could not never centralized my brain on it
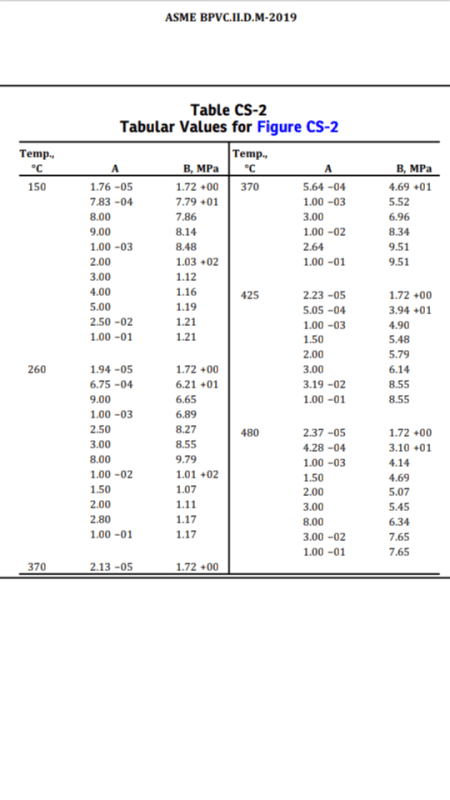
Last question , is there any table that specify A or B values?

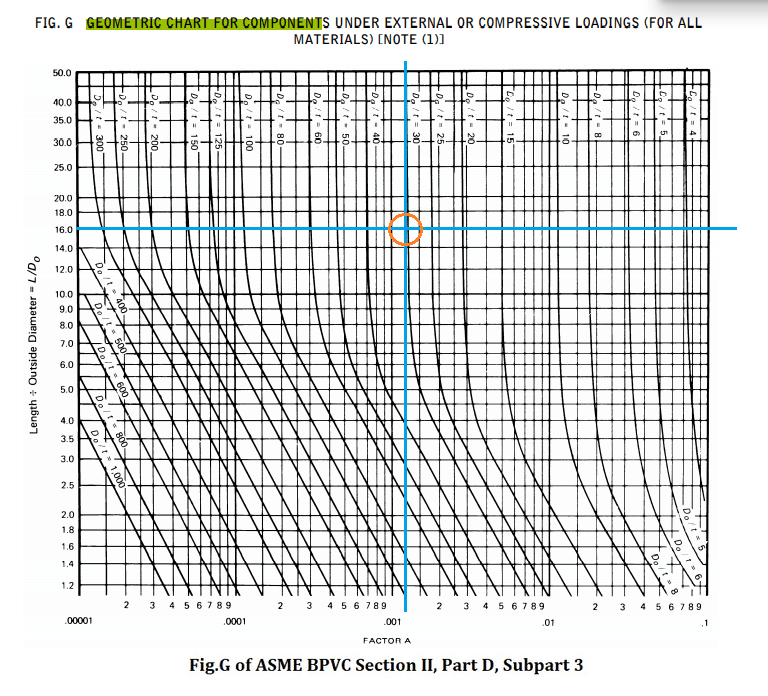
Didtance between two lines 0.001 And 2 ( after that ) and lines between 2 & 3 not same len , confused !!!
 
In following figure factor a considered 0.0014 (blue line) my question is factor A at factor b=90 is 0.0013 ? also factor A at factor b=100 is 0.0016 ? So the factor b at factor a=0.0014 = 93.3 or greater???

Screenshot_%DB%B2%DB%B0%DB%B2%DB%B1-%DB%B1%DB%B1-%DB%B2%DB%B5-%DB%B2%DB%B0-%DB%B5%DB%B4-%DB%B4%DB%B2_mzrstf.png
 
Screenshot_%DB%B2%DB%B0%DB%B2%DB%B1-%DB%B1%DB%B1-%DB%B2%DB%B6-%DB%B0%DB%B0-%DB%B4%DB%B1-%DB%B0%DB%B1_nmb1u2.png


I found tabular values after finishing the charts for temp 150 degree and factor A=0.00135
1)Column B for factor 2 is 84.8 and for col B factor 3 is 103mpa?
2)using the chart really definition of values is difficult.how you calc without tabular values using only charts , if read the chart factor b is 13600 if use tabular values like above factor b is 13200 maybe 13220 , theses difference no problem????
 
Status
Not open for further replies.
Back
Top