Eng-Tips is the largest engineering community on the Internet

Intelligent Work Forums for Engineering Professionals

  • Congratulations waross on being selected by the Tek-Tips community for having the most helpful posts in the forums last week. Way to Go!

Question about history output

Status
Not open for further replies.

flowglow

Mechanical
Apr 30, 2014
14
0
0
FR
Hello,

I have a question about energy history output.

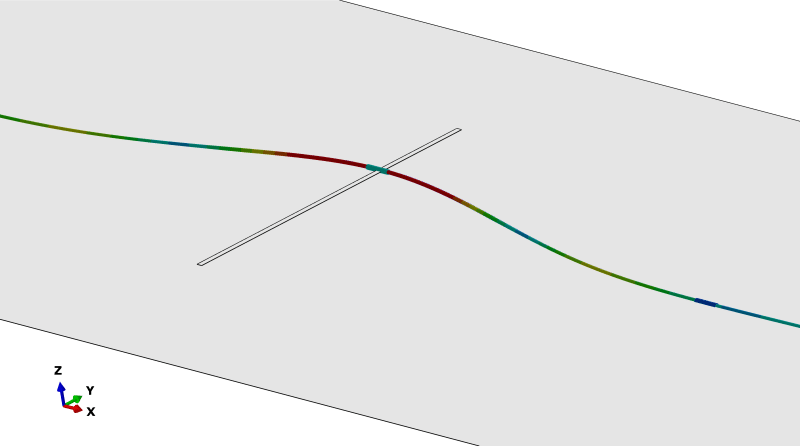
Short description of the mechanical problem:
1) Static analysis;
2) Pipe31H elements;
3) Elastic-Perfectly plastic material (no UMAT, just two point *PLASTIC definition)
4) Pipeline is laying on a flat surface (+friction interaction);
5) Loading is applied through a) static temperature field; b) internal/external pressure.

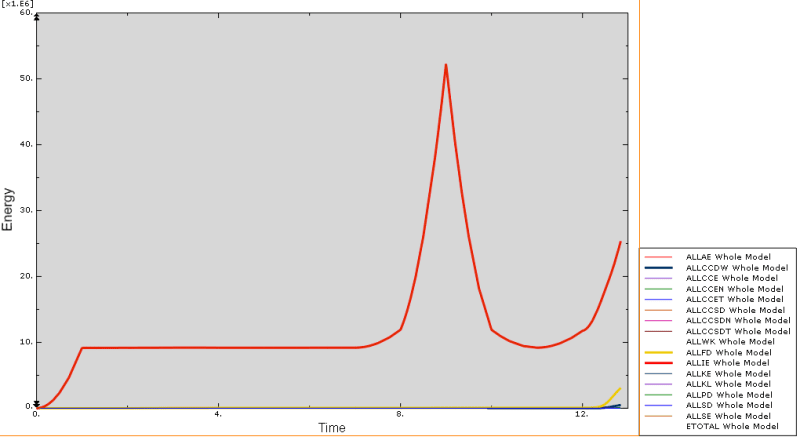
I know that ETOTAL should be ~constant close to 0, but when I plot energies output I see this:
ALL_energies_output_yu88uc.png

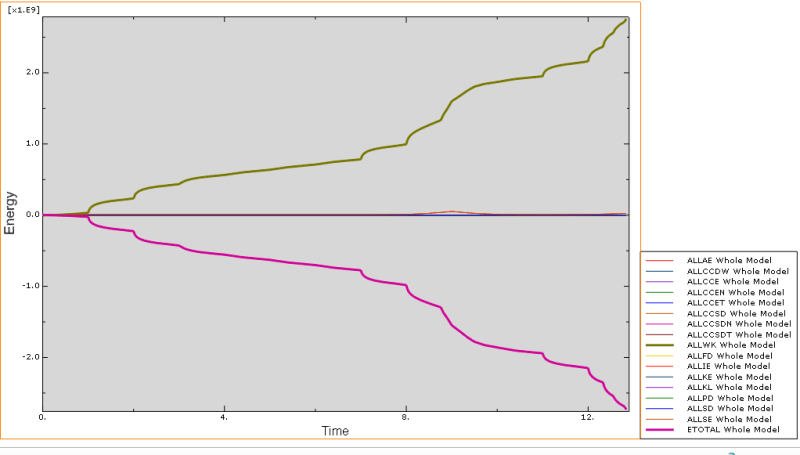
So, ETOTAL = -ALLWK (External work)

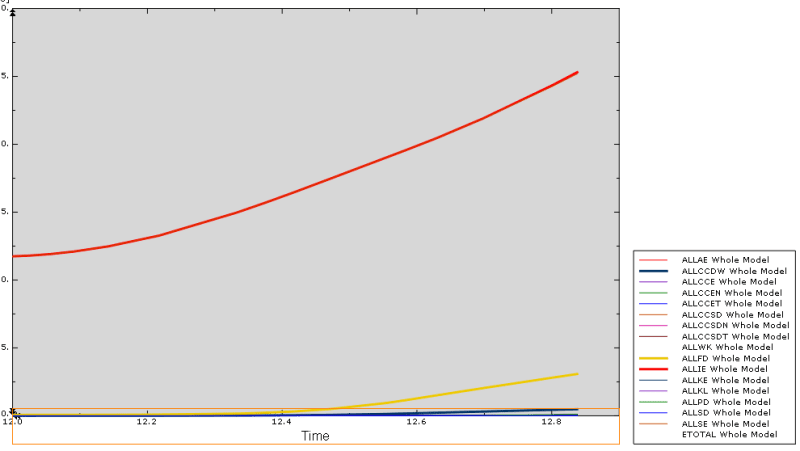
If we disable these outputs the rest looks pretty standard:
ALL_except_ALLWK_and_ETOTAL_tzjlzn.png


I am a little lost: what can cause such results? Don't really know how to crack this problem.

Thank you for any help/input in advance.
 
Replies continue below

Recommended for you

A few suggestions/remarks:
- compare various energies one by one, some relations fade away when all energies are plotted together
- do standard energy checks suggested by the documentation
- check other outputs - contour plots of stresses, displacements, contact variables, and so on (make sure that they look correct)
- check the deformed shape of the model - does the deformation agree with the expected response to loads ?
- if the field outputs seem fine, compare them with energy plots (you can even animate them together using linked viewports) to see what happens in the model around those peaks
- read all the warning messages in the output files
- try refining the mesh
- do you use stabilization ?
- see the documentation chapter "Energy computations in a contact analysis"
 
Thank you for your reply.

General comments:
1) The problem is pipeline buckling:
3d_view_bjbqxa.png

2) I've decided to plot all available energy outputs when discovered that the ETOTAL is not constant and a lot much higher than the IE. I thought it would help to identify some "energy leakage" but for the moment it only created more questions.

Here are my answers:
1) For me all except ALLWK and ETOTAL looks reasonable. IE changes due to mostly elastic deformation. Maybe I would expect more of frictional dissipation. BTW, here is the zoom of the rightmost part of the graph:
Energies_Zoom_1_uxw0lq.png


2) Standard Energy checks suggest ETOTAL = constant ~= 0. Here it is way far from that. However, I don't have a clue why is that.
3) Sanity check is passing: strain/stress, displacement (and so the deformed shape) and forces outputs look reasonable.
4) Is there a theoretical limit in mesh refinement for Pipe31H elements? I am using ~Diameter/2 for the most refined regions near the high deformations (lateral displacements as on the figure above).
5) I do use automatic stabilization (*STATIC, STABILIZE=1e-06) at all simulation steps. Stabilization Dissipation energy is negligible compared to others (e.g. IE).
 
So you checked all the energies by displaying them separately on the chart ? That’s important because it so happens that some energy component overlaps perfectly with other energies and thus it can’t be distinguished from them. Maybe you could attach the cae or inp file ? I would take a look at the model and the results.

Another thing that you can try to find the cause is to remove the more advanced model features and check whether the issue persists. This way you might be able to identify the problematic aspect of your model.
 
Status
Not open for further replies.
Back
Top