cluue
Student
- Nov 20, 2020
- 1
Hello there,
I setup a shell composite layup using HyperMesh to solve it via Abaqus. I need to analyse the output of each ply. I was told that I can do that by putting the following commands into my input file:
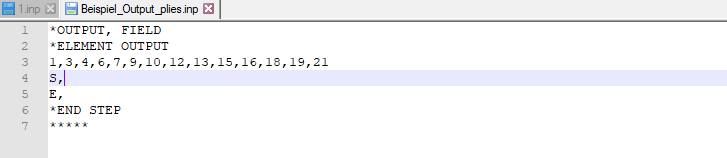
So that (i used 3 integration points per ply) I do get the results for each ply individually, regarding to the Abaqus documentation (
So i do have 7 plies, whith 3 integration points each.
What I am currently wondering about is how to get that information printed to my .dat file.
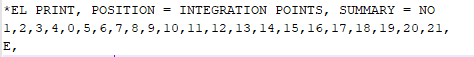
I used the following commands:
The output now looks like that:
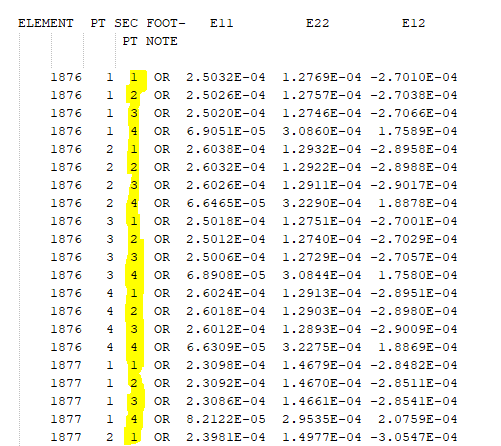
I expected 21 outputs per element. I am using S4 Shell elements so i feel like PT 1...4 means it does that for each individual integration point of my element but why only for 4 sections points each?
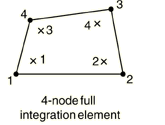
I kinda feel like I got mixed up with integration and section points here. Maybe somebody can help me out clarify that issues.
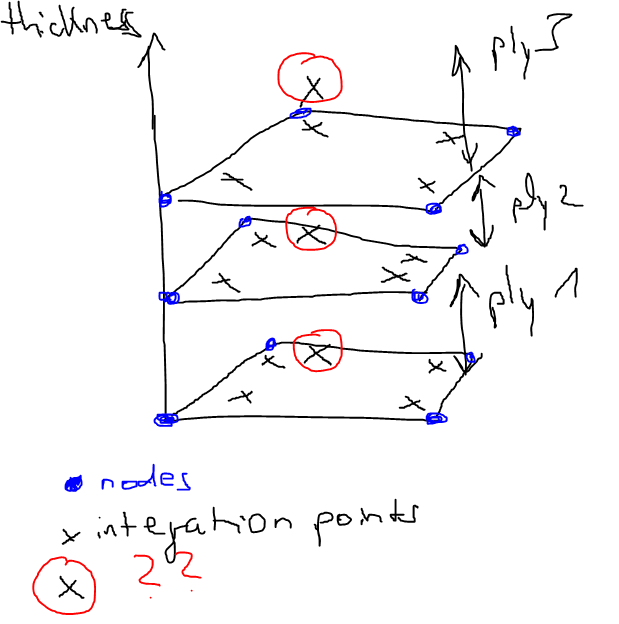
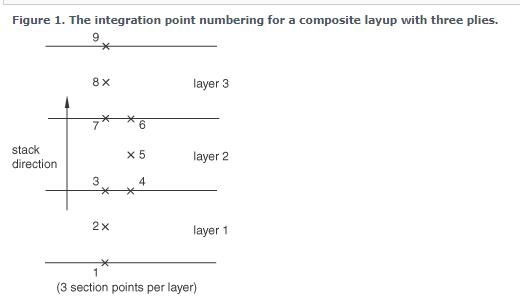
I tried to visualize my problem roughly to make clear what infos I try to generate. So I wanna print out the results for the black crosses with the red circles. Whatever I am generating right now
image
Thanks a lot for any advice and have a great weekend everybody.
Best regards
I setup a shell composite layup using HyperMesh to solve it via Abaqus. I need to analyse the output of each ply. I was told that I can do that by putting the following commands into my input file:
So that (i used 3 integration points per ply) I do get the results for each ply individually, regarding to the Abaqus documentation (
So i do have 7 plies, whith 3 integration points each.
What I am currently wondering about is how to get that information printed to my .dat file.
I used the following commands:
The output now looks like that:
I expected 21 outputs per element. I am using S4 Shell elements so i feel like PT 1...4 means it does that for each individual integration point of my element but why only for 4 sections points each?
I kinda feel like I got mixed up with integration and section points here. Maybe somebody can help me out clarify that issues.
I tried to visualize my problem roughly to make clear what infos I try to generate. So I wanna print out the results for the black crosses with the red circles. Whatever I am generating right now
image
Thanks a lot for any advice and have a great weekend everybody.
Best regards