Hi, guys!
I am studying the influence of the bending and torsional stiffness of BIW on the handling. The process is as follows:
(1) Obtain the mnf file of the BIW by HyperMesh (CMS);
At this stage, to simplify the model, I removed the seats, doors and interior. In order not to change the mass center and moment of inertia of the whole vehicle, I used concentrated Conm2 at the mass center of each deleted part, and use rbe3 to connect them with the surrounding elements.
(2)Buliding the rigid multibody dynamic model in Adams/car;
(3) Replace the Chassis Part (rigid) with the mnf file of the BIW to obtain the rigid-flexible coupling multibody dynamic model;
I've verified that it was successful to simulate for the handling. The output curves of the rigid-flexible coupling model were very close to that of the rigid body model. However, there are huge errors when I use the same model to simulate for the ride. I guess that the method of obtaining the mnf file is problematic.
The following is the output result of a ride comfort simulation test under the condition of deceleration belt:
Note: Red-- the rigid-flexible coupling multibody dynamic model;
Blue--the rigid multibody dynamic model;
pink--the test data;
The measuring point is located at the bolt hole connecting the seat and the guide rail. For the ride simulation, the output curves is good in x direction (the direction of the vehicle). But in z direction being vertical to the ground, when the front wheel passes through the deceleration belt, the longitudinal acceleration of the rigid-flexible coupling multi-body dynamic model is too large. And the trend also seems to be wrong.
Please help me! It is appreciated for any reply!
I am studying the influence of the bending and torsional stiffness of BIW on the handling. The process is as follows:
(1) Obtain the mnf file of the BIW by HyperMesh (CMS);
At this stage, to simplify the model, I removed the seats, doors and interior. In order not to change the mass center and moment of inertia of the whole vehicle, I used concentrated Conm2 at the mass center of each deleted part, and use rbe3 to connect them with the surrounding elements.
(2)Buliding the rigid multibody dynamic model in Adams/car;
(3) Replace the Chassis Part (rigid) with the mnf file of the BIW to obtain the rigid-flexible coupling multibody dynamic model;
I've verified that it was successful to simulate for the handling. The output curves of the rigid-flexible coupling model were very close to that of the rigid body model. However, there are huge errors when I use the same model to simulate for the ride. I guess that the method of obtaining the mnf file is problematic.
The following is the output result of a ride comfort simulation test under the condition of deceleration belt:
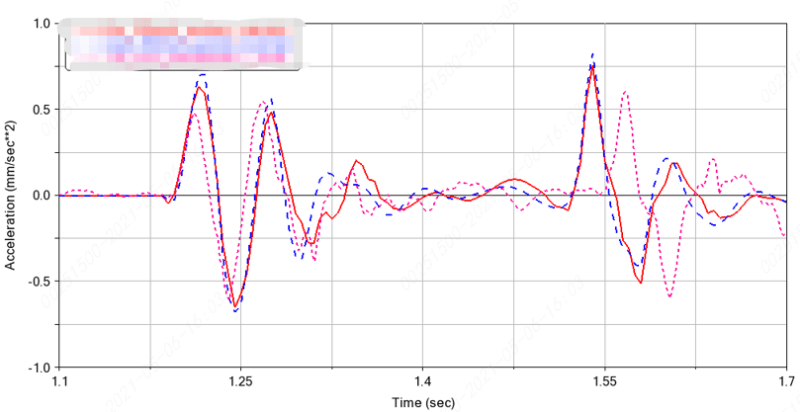
Figure1. seat rail bolt x acceleration
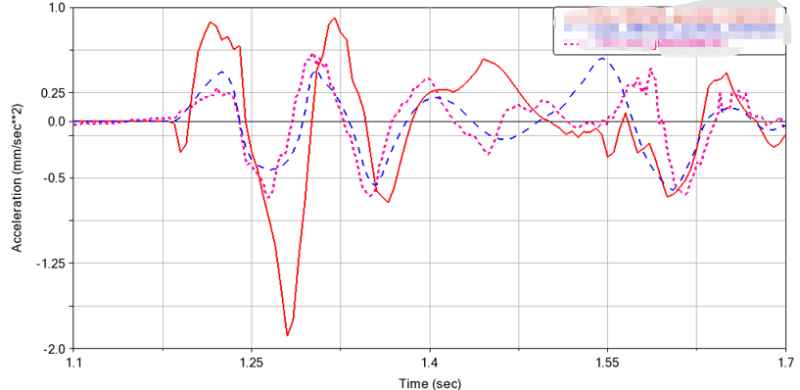
Figure2. seat rail bolt z accelerationNote: Red-- the rigid-flexible coupling multibody dynamic model;
Blue--the rigid multibody dynamic model;
pink--the test data;
The measuring point is located at the bolt hole connecting the seat and the guide rail. For the ride simulation, the output curves is good in x direction (the direction of the vehicle). But in z direction being vertical to the ground, when the front wheel passes through the deceleration belt, the longitudinal acceleration of the rigid-flexible coupling multi-body dynamic model is too large. And the trend also seems to be wrong.
Please help me! It is appreciated for any reply!