Continue to Site

Eng-Tips is the largest engineering community on the Internet

Intelligent Work Forums for Engineering Professionals

  • Congratulations KootK on being selected by the Eng-Tips community for having the most helpful posts in the forums last week. Way to Go!

Simcenter SOL108 Direct Frequency Response Graphic

kowalski98

Aerospace
Nov 6, 2024
4
Hi all!
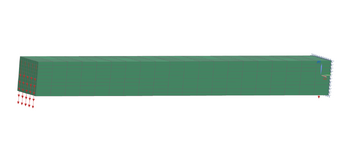
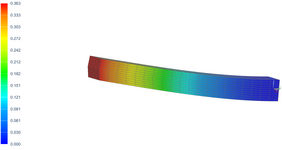
I am running a direct frequency response analysis, and was using a test cantilevered beam to make sure my setup was correct. I performed a frequency sweep, but when I visualized the results, it shows the beam bent up instead of down, even though the force is acting downward. Can someone why Simcenter is visualizing the issue in this way? Can you just not trust the visual results of a direct frequency response solution and instead look at a static response to visualize part deflection?
Pictures below
1733191358647.png1733192759804.png
 
Replies continue below

Recommended for you

Can you just not trust the visual results of a direct frequency response solution and instead look at a static response to visualize part deflection?

Better not trust users that do not understand how Frequency Response Analysis works.

In Frequency Analysis you define oscillating load that change from positive to negative value according to sine function. In result of Frequency analysis you obtain Amplitude and Phase of some value of interest (like stress, force of nodal displacement). Amplitudes have only positive values but it is suggested that all you result values also change from positive to negative values according to sine function.
 
If that's the case, is there a way to apply a constant load in addition to the sine load to "offset" the direction of the load in a direction to get a better visual result?
 
Ugh...

In Femap you can use tool Model->Output->Process to multiply all results by "-1" but i don`t know if NX has similar tool. Again in Femap it is possible to expand dynamic results from Amplitude/Phase to results at discrete phase angles so you get results from positive to negative amplitude with some step like 10 degrees so you can find case with negative deflection.

If you need some fancy colorful pictures that why not calculate static case and rename it to "SOL108 Direct Frequency Response Results". Accuracy will be the same as if you combine dynamic and static results. If people to whom you present your results don`t know how linear dynamics works than i bet they won't be able to tell the difference between static and dynamic result. Not to mention some NASTRAN specific terms like SOL101 or SOL108.

Or maybe you explain to your supervises/clients/benefactors how frequency response and dynamic calculations in general works so they do not request impossible results from you.
 
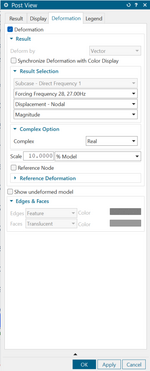
thanks for the info! I ended up finding a setting in the "Edit Post View" under the Deformation Tab. Changing the Complex display option from "Amplitude" to "Real" displays the correct deformation in the graphics post viewer.
1733280298251.png
 

Part and Inventory Search

Sponsor