Continue to Site

Eng-Tips is the largest engineering community on the Internet

Intelligent Work Forums for Engineering Professionals

  • Congratulations pierreick on being selected by the Eng-Tips community for having the most helpful posts in the forums last week. Way to Go!

Single Pile under Lateral Loading using SAP2000

Status
Not open for further replies.

ashkaaana

Civil/Environmental
Sep 16, 2017
7
Hi all,

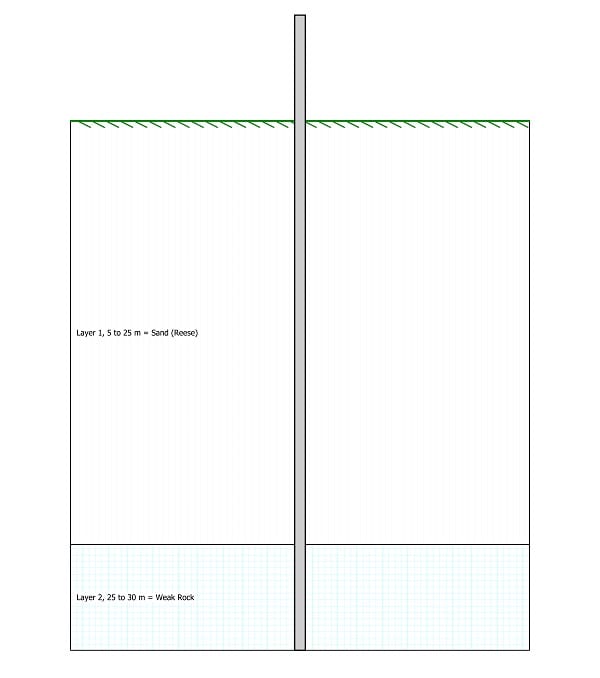
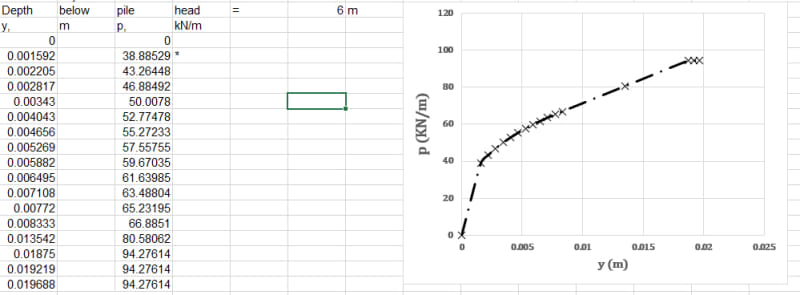
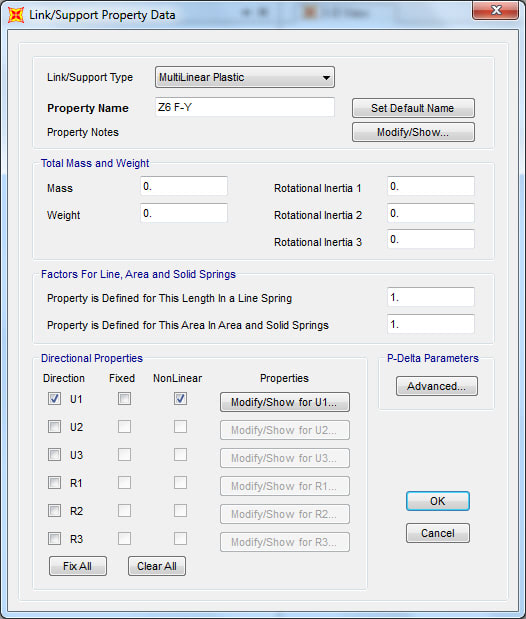
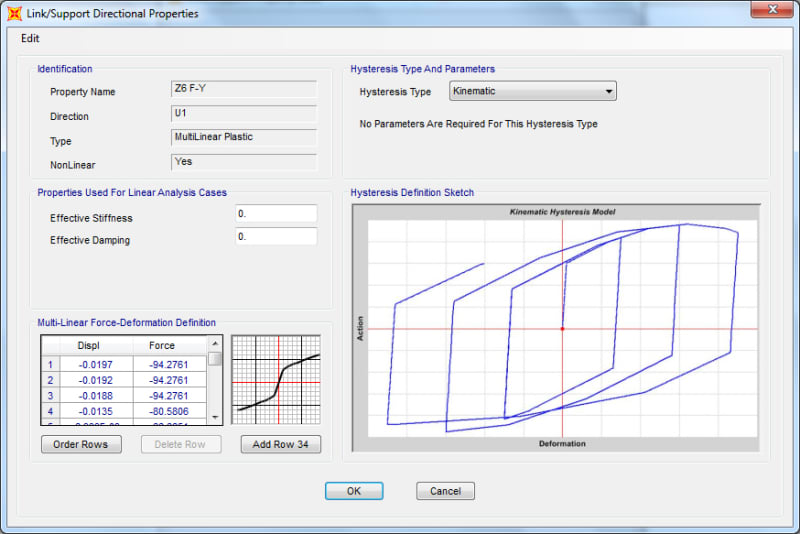
I'm want to analyze pile group using p-y curves metthod. I start it with modeling a simple single pile for verification with LPILE results. Every time i model pile and soil in sap2000, i get different results from LPILE. I search books and articles but none of them have my problem. can anyone help me with this? I really need to this as soon as possible.
 
Replies continue below

Recommended for you

There's no reason why two different software should give identical results. It is quite possible that the calculation procedure is different or, if the same method, it could be implemented in a slightly different way. That aside, your inputs might not be entirely identical in both software.
 
so what is your solution for my problem dear LRJ?
 
i used this example to verificate results between sap2000 and lpile:

Soil-Pile_Profile2_dwopet.jpg


i create p-y curves of sand profile in lpile (every 1m along the pile), and then i used this curves in link element (multilinear plastic). since i create py curves every 1 m along the pile, so the tributary length of every node is 1 m, and p-y curves remain unchanged when converted to f-y.

i used a displacement control analysis for this example,so i defined a nonlinear static load in load cases with the load type accel in desired direction. as i said the load application was displacement control with the monitored displacement in that direction (for example 2 cm in top of the pile node)

is there anything wrong with this procedure?
 
Please look into how LPILE and SAP2000 calculate the solution, i.e. what methods those software use (LPILE is 1D FEA; I'm not sure about SAP2000). I expect that the software do not calculate the solution in the same manner, which will inevitably give rise to different results. Moreover, the 'solution' is to understand how the software differ and why different methods lead to different results.
 
How did you import the p-y curves generated by LPILE into SAP? I think the p-y generated by LPile would be non linear and you'd have used them in SAP as linear spring. May be this is the reason for discrepancy.
 
as i said, i used the p-y curves from lpile to generate the f-y (force displacement) curves that are used in Link element. so for every node along the pile i have on specific link element. i specify the link type to be multilinear plastic, based on a method that is described here in csi page:


for example for the first node ( 6m below the pile head):

orginal p-y curve from lpile
2018-04-14_13-06-51_m6wsyd.jpg


Link element property data
2018-04-14_13-07-15_hcd4b3.jpg


Link directional properties
2018-04-14_13-07-30_nur8oo.jpg
 
Dear LRJ,

lpile use a finite differnce method to calculate the solution, but sap2000 use finite element method.
but i see some papers and thesis that used sap2000 to calculate the solution and they gave the same solution as lpile.
 
ashkaaana,

What type of discrepancy are you seeing in your results?
 
Status
Not open for further replies.

Part and Inventory Search

Sponsor