Eng-Tips is the largest engineering community on the Internet

Intelligent Work Forums for Engineering Professionals

  • Congratulations waross on being selected by the Tek-Tips community for having the most helpful posts in the forums last week. Way to Go!

Stepwise plots 3

Status
Not open for further replies.

Mccoy

Geotechnical
Nov 9, 2000
907
0
0
IT
Dear all,
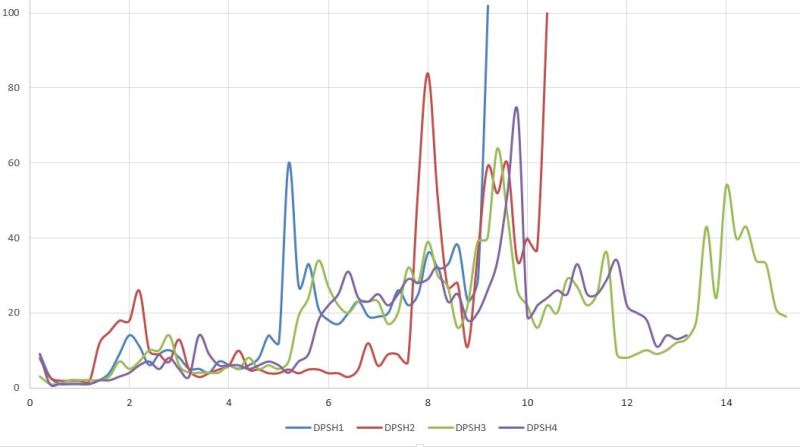
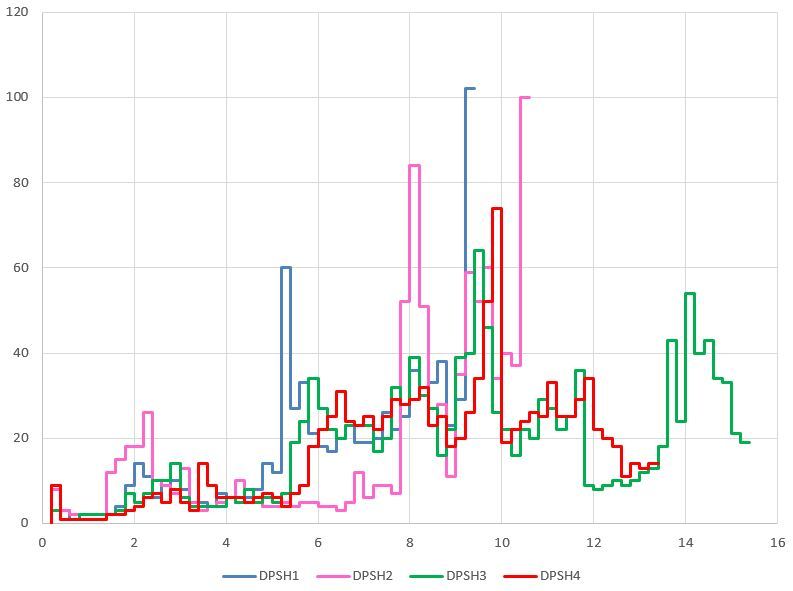
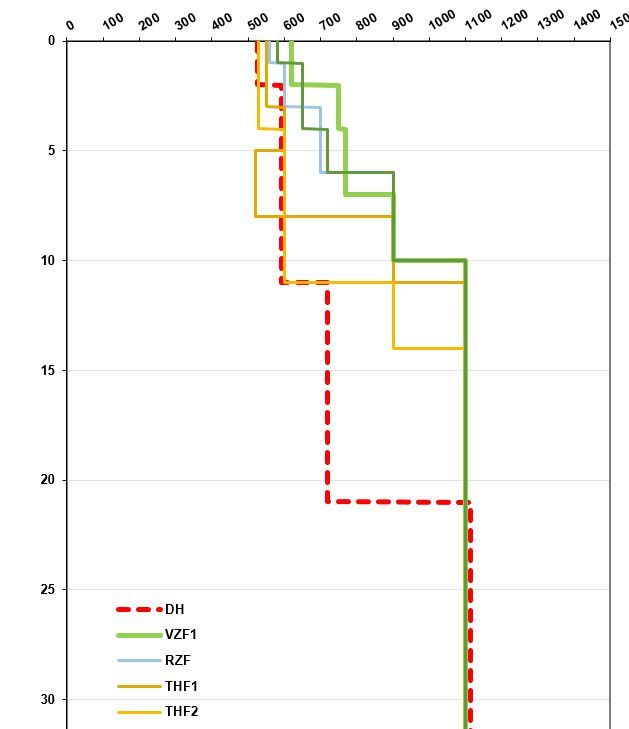
My issue is interval or stepwise plots similar to those in the portrayed illustration (soil parameters versus depth). I could not find a direct way to plot them so I had to use an IF statement. The IF statement I used has also a problem that is, if the value is not the same for at least two consecutive cells, the stepwise pattern is disrupted. I'm also attaching the Excel file I used (Excel 2013). I need a stepwise plot since the soil properties are often measured as a spatial average over a depth interval and not a single point along the investigated vertical. Is there an easy way around this? My datasets contain usually no more than 60 interval values. Depth along the X-axis would be all right as well.

Vs_profile_eifsij.jpg


www.mccoy.it
 
Replies continue below

Recommended for you

hi,

Your file apparently has some problems, as my laptop indicates...

Duplicate headers received from server

Hide details
The response from the server contained duplicate headers. This problem is generally the result of a misconfigured website or proxy. Only the website or proxy administrator can fix this issue.
Error code: ERR_RESPONSE_HEADERS_MULTIPLE_CONTENT_DISPOSITION


Skip,
[sub]
[glasses]Just traded in my OLD subtlety...
for a NUance![tongue][/sub]
 
The original data are vectors of numbers (arranged in columns), each number is a spatial average of 1 meter in the above example, the original data are in the attached sheet if it was possibl for you to download it.

I'd like to process the data of one of my latest geotehnica investigations. I'm going to attach it here. First column, depth. Other 4 columns, N20, Number of penetrometer blows per 20 centimeters of depth. I can visualize immediately a plot like this one:

DPSH_kclwh3.jpg


But I'm not able to visualize immediately a stepwise plot of the same data. Data vectors should look like the edges of overlapping bar graphs. That is, each data should have a lenght of 20 cm interval depth.

www.mccoy.it
 
Your PLOT data ought to look something like this (just using ONE series) using SCATTER with Straight Lines...

[pre]
Profondità DPSH1

0.2 0
0.2 9
0.4 9
0.4 3
0.6 3
0.6 1
0.8 1
0.8 1
1 1
...
[/pre]

I applied Named Ranges to the source data using Create Names in TOP row.

The Formula in B3 and following. (B2 contains 0 hard coded)
[tt]
B3: =IF($A3=$A2,INDEX(INDIRECT(B$1),MATCH($A3,INDIRECT($A$1),0),1),B2)
[/tt]


Skip,
[sub]
[glasses]Just traded in my OLD subtlety...
for a NUance![tongue][/sub]
 
Oh, yes for the X axis values

A2: 0.2
A3: 0.2
A4: = A2+.2

copy A4 down as far as needed.

Skip,
[sub]
[glasses]Just traded in my OLD subtlety...
for a NUance![tongue][/sub]
 
Skipvought, thanks very much, the plot is just what I wanted, I never applied the Excel functions you used. I just eliminated the zeros so that it is clear where the single tests (resistance vectors) end.
I'm going to attach the graph so that the desired effect is clear to everyone.

DPSH2_fv5ziq.jpg


Alternative set up, which is slightly simpler, and will deal with data with non-uniform depth increment:

With the data as in the sample file:
In Row 5, Columns I to M enter 1,2,3,4,5
In Row 6, Columns I to M enter 0, =B6, =C6, =D6. =E6 (i.e. 0, then values from first row of data)
In Column H from row 6 downwards enter 1, 1, then =H6+1 and copy down as far as required.
In I7: =INDEX($A$6:$E$81,$H6,I$5)
In J7: =INDEX($A$6:$E$81,$H7,J$5) and copy across to Column M
Copy I7:M7 down as far as required.

See attached file.

Doug Jenkins
Interactive Design Services
 
Status
Not open for further replies.
Back
Top