Eng-Tips is the largest engineering community on the Internet

Intelligent Work Forums for Engineering Professionals

  • Congratulations waross on being selected by the Tek-Tips community for having the most helpful posts in the forums last week. Way to Go!

Tangent Modulus Curves for Stainless 301 1/4HD in MMPDS and Ramberg-Osgood Method

Status
Not open for further replies.

Kevin James

Mechanical
Apr 7, 2020
10
0
0
CA
Good Afternoon,
I am in the process of creating standardized calculation sheets for a new job. One of the sheets will be a buckling and crippling sheet, based on Flabels/bruhn niu etc.... The issue I am having is with the tangent modulus curves presented in MMPDS-01.
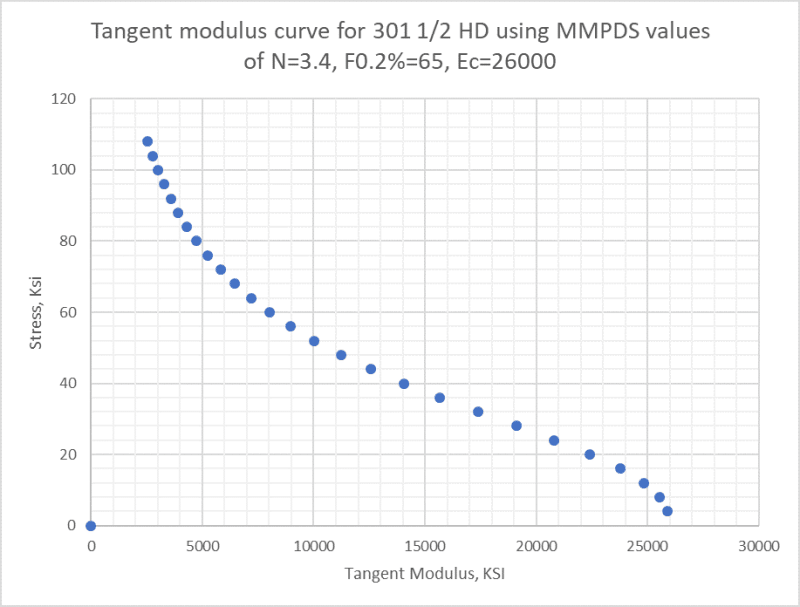
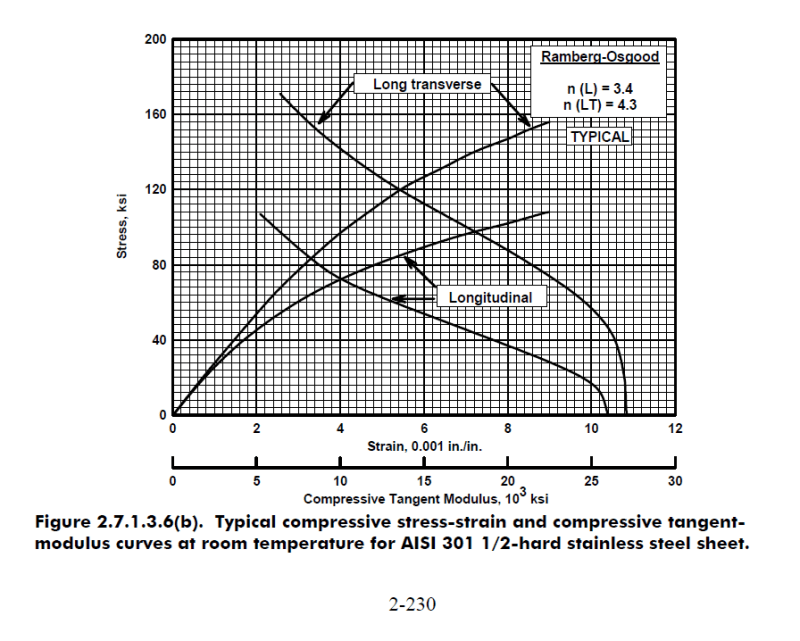
Each compressive stress strain and tangent modulus graph has a ramberg-osgood (n) number listed in it. Using this and the F0.2% (Fcu) yield stress of the material, you are supposed to be able to recreate the tangent modulus or stress strain curve. In the passed I just read off the values from those graphs, but I would like the spreasheets to be a bit more user friendly and automated.
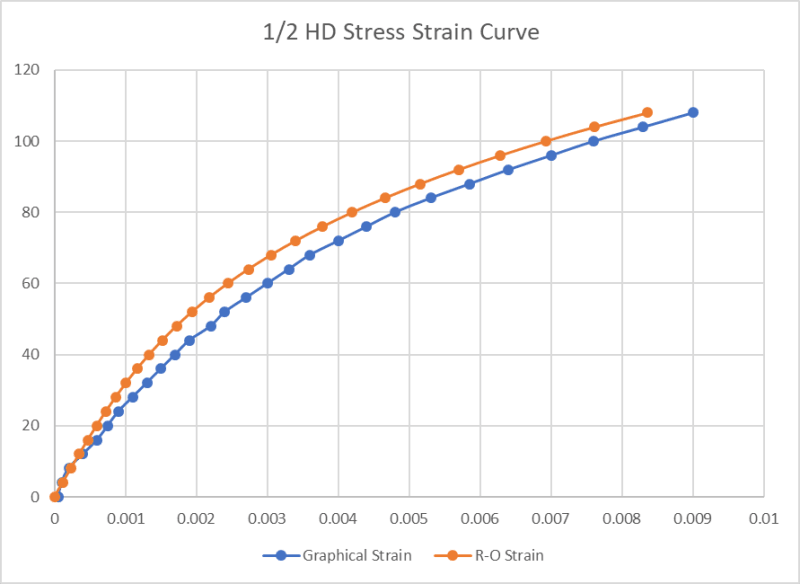
Here is the issue I am having. Using the given n value and Fcu listed in MMPDS for the material, I can't recreate the curves to a good accuracy. I was able to fudge the numbers around until I got it, but its not the right way. I am wondering what I am missing about these graphs. Here is an example of the deviation between ramberg-osgood and the given graphs in MMPDS. I have checked everything I can think of but have been driven to write my first post ever on Eng-tips. Thank you in advance. I hope this is in the right section.
Could it be the wrong basis? Some other value of Fcy? I have read the section on creating the graphs in MMPDS. I have read the section on R-O also. The graphs for 1/4HD have an even worse offset.
James
1/2 HD Fcy: L A basis: 61ksi n=3.4

Stress-Strain_MMPDS_halfHD_rghsib.png

Stress_Strain_CUrves_hmstab.png


Replies continue below

Recommended for you

Good morning,
Since I have not had any replies, I suppose my question is too specific. Can I ask how other people usually go about generating stress-strain curves for materials? Do companies do thier own internal testing on materials and generate thier own material properties database? I would have expected this to be more standardized than that?
Any suggestions or comments would be helpful.
James
 
ok, you've found that the two pieces of data, the two approaches to generating the stress/strain curve, do not agree "perfectly".

Generating a curve for Et read from a curve is IMO less reliable than ramberg-osgood parameters, since the latter is simply math. So I would use the ramberg-osgood approach, and state this. I am surprised that there is so little linear range; that yield stress (.2% offset) looks <40ksi ?

another day in paradise, or is paradise one day closer ?
 
Hello
Welcome to Eng-Tips.
Sorry to see your first try didn't get any response. The "Structural" forum is dedicated to buildings (civil eng.) not mechanical, and few have heard of MMPDS, there.

I suspect someone has already tried to work this out before you. Your spreadsheet calls to mind Abbott's series of spreadsheets (found one similar already):


Thank you for the replies,
@sparWeb that spreadsheet helped confirm I am using the right formulas in my own spreadsheets for tangent modulus so thank you.Is it possible to move a thread? I also posted in the aerospace section but no replies? Still getting used to the organisation of the forum.
The real issue is that the two approaches differ by a lot.
Here is a graph I generated for 1/2 HD 301 in Longitudinal direction:
1_2_HD_Et_cuty6z.png

And the same curve from MMPDS page 2-230:
MMPDS_1_2HD_Et_aknjb5.png

You can see for example that the tangent modulus I calculate for 80 ksi stress is just under 5000 ksi but looking at the MMPDS graph it is just under 10 000 ksi.
This is a large difference and makes a huge difference when I calculate buckling and crippling allowables...
Any ideas?
James
 
your points look a lot like the L curve (with Ec = 26000ksi) …

From the LT curve, Ec = 27000ksi …

To remove a thread, RF it (the Red Flag "report" icon) and ask admin to delete.

another day in paradise, or is paradise one day closer ?
 
The data and curves in MMPDS are based on statistics, fairly large samples and rigorous analysis.
The values and curves are both reliable, but don't expect them to be identical.
After all the curves are related to a fit to the model, not exact physical measurements.
If you really want to know contact Battelle Columbus and talk to one of the MMPDS folks (such as Jana Rubadue).

= = = = = = = = = = = = = = = = = = = =
P.E. Metallurgy, consulting work welcomed
 
Hi EdStainless,
Thank you for your input. I did contact Battelle and you are right, the stress strain and tangent modulus curves are generated using large sample statistical analysis and not the values listed in the standard such as the A, B or S basis values, which are less since they are based on different confidence levels. Battelle was actually really helpful to me when I called, hats off to them. They agreed with me that all the info required to reproduce the stress strain curves etc should be included and available for users of the MMPDS standard. I spoke with Carinne and she did not have an immediate record of the values used to generate the curves because they were extract from paper copies of the Data in the early 80's. She is investigating and will get back to me eventually.
Two more points. First, I can probably just use the values from MMPDS which would give conservative results. (to be verified not sure which way it would skew without looking at the formulas)
and second is that in the latest issue of MMPDS coming out soonish, they have deviated from using the ramberg osgoode method in favor of some other more advanced methods to generate the curves. I am waiting for it to be released, but man its a hit on the wallet. Still havent got the nerve to ask my supervisor for this expense.
Thanks to all who posted. I will update here if any developments.
James
 
"Could it be the wrong basis? Some other value of Fcy?"
This rings a bell. When recreating the stress-strain curve in the plastic regime: I believe the R-O parameters in MMPDS are valid from proportional limit through to yield, but not beyond yield.
(Whereas some proprietary design manuals contain both n_initial and n_ultimate, the latter being applicable beyond yield)
 
If you are using this for critical applications I would use the MMPDS values and generate conservative results. You could always have the option of going back to the actual data for re-evaluation of cases that were very close to the limits.

= = = = = = = = = = = = = = = = = = = =
P.E. Metallurgy, consulting work welcomed
 
Status
Not open for further replies.
Back
Top