zappedagain
Electrical
I’m a bit rusty on my S-parameters and I ran into something interesting (about 9 questions worth). I’m attempting to determine the leakage inductance on a transformer. Measuring the inductance at the switching frequency is straightforward, but the only equipment I can measure with at the ringing frequency is a VNA. I get some interesting plots on the Smith Chart so I’m looking for confirmation of my findings.
Does the long wire length in the transformer introduce a time delay (transmission line effect)? I ask because the impedance keeps looping (clockwise) around the Smith Chart as the frequency increases. Is there a way to model this or calibrate it out? Or is there another explanation?
Here is the plot of S11 on the primary with the secondary open circuit:
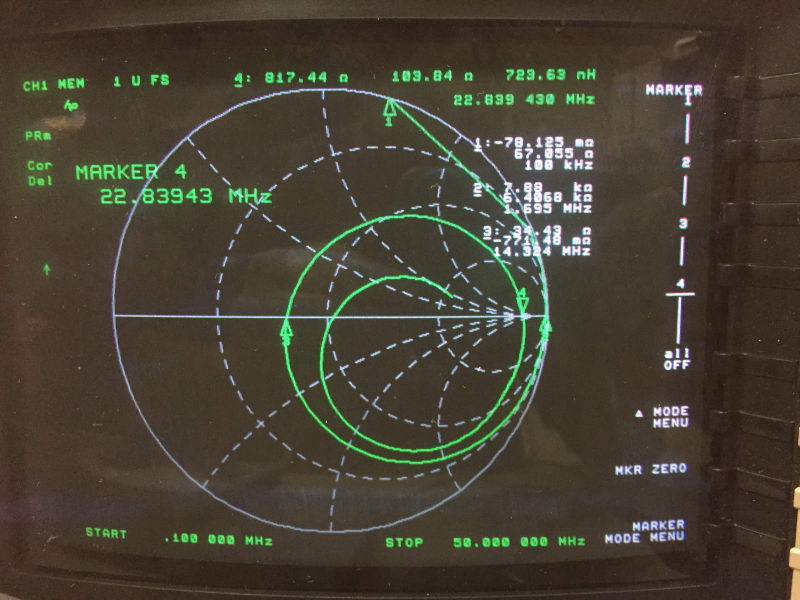
Marker 1 is at 100 KHz and shows my expected inductance of 106 uH (67 jOhm). That make sense.
At frequencies above that the inductance increases, with Marker 2 showing 6.4K at 1.7 MHz (106 uH is 1.1K jOhm). I’m assuming this is a change in the magnetic core properties with frequency.
Marker 2 at 1.7 MHz appears to be the self-resonant frequency (SRF), as I cross from positive (inductive) to negative (capacitive) at higher frequencies.
Marker 3 at 14 .3 MHz seems to indicate a null in the impedance (34 ohm); is this where the parasitic inductance on the parasitic capacitance starts to come into play?
Marker 4 indicates another SRF harmonic at 22.8 MHz. This isn’t at an integral multiple of Marker 1 (1.7 MHz), so is that an improper interpretation?
It seems like the long wire length in the transformer is introducing a time delay (transmission line effect) as I keep looping (clockwise) around the Smith Chart as frequency increases. Is there a way to model this?
My turns ratio is 3:1. Could I put a 5.5-ohm resistor across the secondary (looks like 50 ohm on the primary) and tune out this shift with an electrical delay parameter?
Here is what S11 looks like with the secondary shorted:
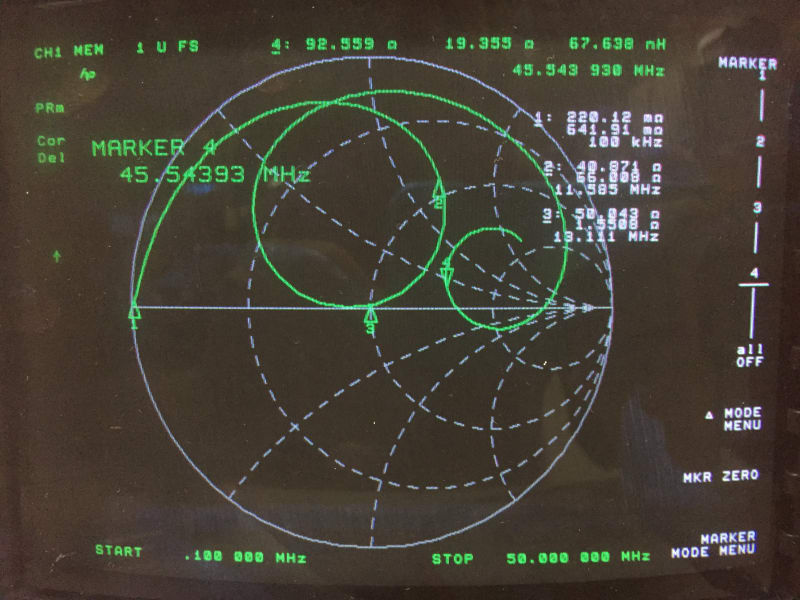
Why did the center of the rotation shift upward into the inductive region?
Marker 1 = 0.64 jOhm at 100 KHz (! 1 uH, that’s reasonable)
Marker 2 = 40 + j66 Ohm at 11.6 MHz, a null in the S11 magnitude display (half of the frequency of the Marker 4 in the open secondary plot; coincidence?)
Marker 3 = 18 nH at 13.1 MHz shows an almost a perfect 50 ohm impedance; I can’t explain that one.
Maker 4 = 67 nH at 45.5 MHz. Can this be explained by core non-linearities?
Thanks for reading this far!
Z
Does the long wire length in the transformer introduce a time delay (transmission line effect)? I ask because the impedance keeps looping (clockwise) around the Smith Chart as the frequency increases. Is there a way to model this or calibrate it out? Or is there another explanation?
Here is the plot of S11 on the primary with the secondary open circuit:
Marker 1 is at 100 KHz and shows my expected inductance of 106 uH (67 jOhm). That make sense.
At frequencies above that the inductance increases, with Marker 2 showing 6.4K at 1.7 MHz (106 uH is 1.1K jOhm). I’m assuming this is a change in the magnetic core properties with frequency.
Marker 2 at 1.7 MHz appears to be the self-resonant frequency (SRF), as I cross from positive (inductive) to negative (capacitive) at higher frequencies.
Marker 3 at 14 .3 MHz seems to indicate a null in the impedance (34 ohm); is this where the parasitic inductance on the parasitic capacitance starts to come into play?
Marker 4 indicates another SRF harmonic at 22.8 MHz. This isn’t at an integral multiple of Marker 1 (1.7 MHz), so is that an improper interpretation?
It seems like the long wire length in the transformer is introducing a time delay (transmission line effect) as I keep looping (clockwise) around the Smith Chart as frequency increases. Is there a way to model this?
My turns ratio is 3:1. Could I put a 5.5-ohm resistor across the secondary (looks like 50 ohm on the primary) and tune out this shift with an electrical delay parameter?
Here is what S11 looks like with the secondary shorted:
Why did the center of the rotation shift upward into the inductive region?
Marker 1 = 0.64 jOhm at 100 KHz (! 1 uH, that’s reasonable)
Marker 2 = 40 + j66 Ohm at 11.6 MHz, a null in the S11 magnitude display (half of the frequency of the Marker 4 in the open secondary plot; coincidence?)
Marker 3 = 18 nH at 13.1 MHz shows an almost a perfect 50 ohm impedance; I can’t explain that one.
Maker 4 = 67 nH at 45.5 MHz. Can this be explained by core non-linearities?
Thanks for reading this far!
Z
")
![[sad]](/data/assets/smilies/sad.gif "[sad] [sad]") The measuring leakage at higher frequencies is the not so normal part...
The measuring leakage at higher frequencies is the not so normal part...