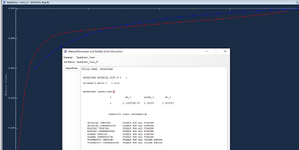
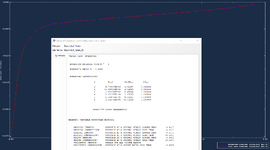
Hello, can someone explain to me why the first plot is stable in the material evaluation and the second is not? This makes no sense to me. Test data from compression test are entered with a negative sign (-strain and -stress).
It’s a different hyperfoam model (with a very different order). Abaqus shows their stability in a given strain range following the concept of the Drucker stability. It’s described in the documentation chapter Hyperelastic Behavior in Elastomeric Foams (paragraph "Elastomeric Foam Material Stability").
i understand its a different order. But why does the better fit match as unstable, and the worse fit as stable? If you compare the plots you can see it .
The level of match between the hyperelastic/hyperfoam model and test results is independent of its stability. It’s a separate concept - you may analyze the material’s stability without comparing it to test results at all.
How would you analyze the stability of the material? I have simulated my simulation model identically to the real experiment and, strangely enough, I get an excellent fit of the simulation data and the real experiment with the unstable material model. With the stable material, on the other hand, I get significant differences.