Eng-Tips is the largest engineering community on the Internet

Intelligent Work Forums for Engineering Professionals

  • Congratulations waross on being selected by the Tek-Tips community for having the most helpful posts in the forums last week. Way to Go!

Which one is RESONANCE peak?

Status
Not open for further replies.

onemilimeter

Electrical
Jul 25, 2009
54
0
0
GB
I carried out impact hammer test on a motor end cap as shown in Figure 1. The hammer has a built-in force sensor. Hammer hits were repeatedly applied at around 'X' location. The vibration response was measured by an accelerometer (blue). The output of the hammer force sensor and the output of the accelerometer were connected, respectively, to Channel-1 and Channel-2 of a dynamic signal analyser (Agilent 35670A). Since the response died out (or decayed) quickly, UNIFORM windowing was used.

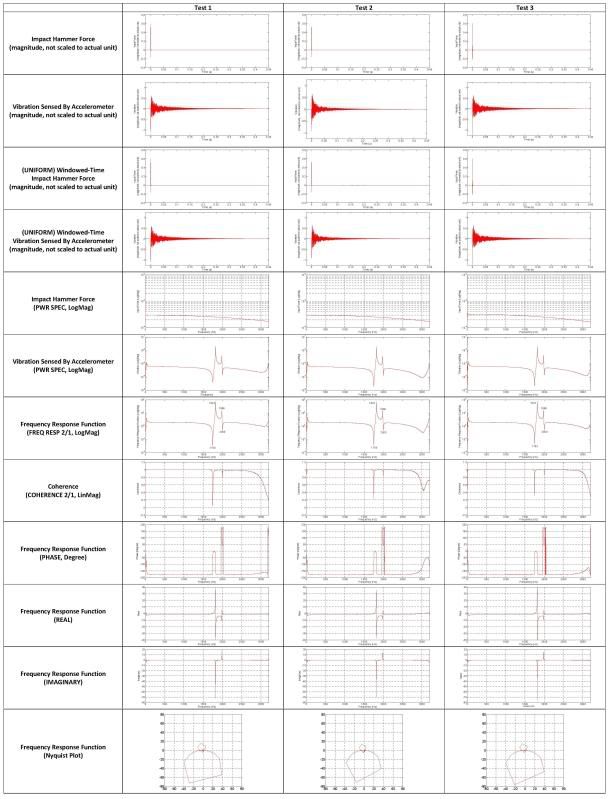
Three (3) tests were performed to check the consistency of my 'skill' to hit the hammer at 'X' location. Each test result was obtained by averaging the results of 5 hits.


Questions

[1] How many resonance peak do you find in the frequency range 0~3200Hz? In my opinion, there is only ONE (1) resonance peak at 1822Hz. Please correct me if I'm wrong.

[2] Kindly refer to coherence plot. What are the factors that you think might contribute to the 'dips' at 1750Hz (or 1754Hz) and 2000Hz? What's about the low coherence value after 2800Hz?

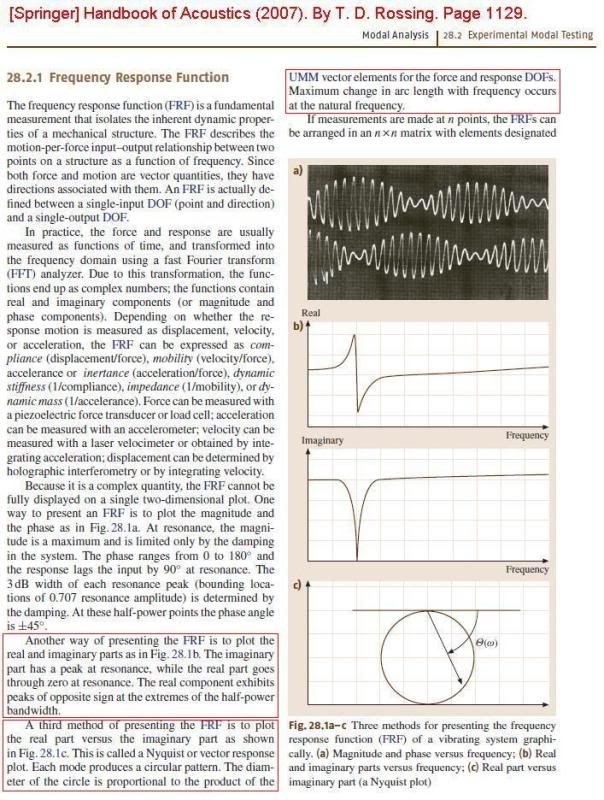
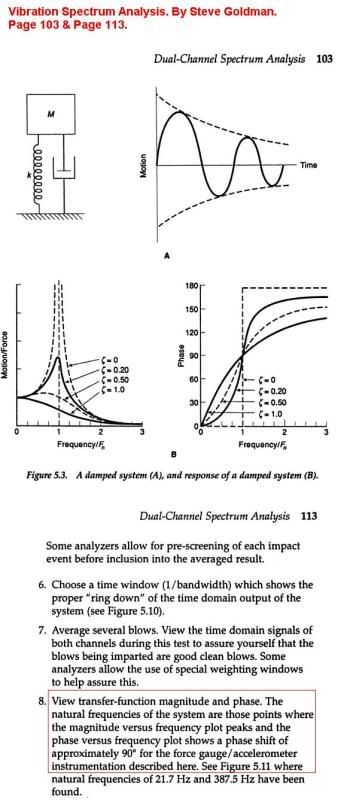
[3] Can we use phase, real and imaginary plots to help identifying the resonance peak? If YES, how?

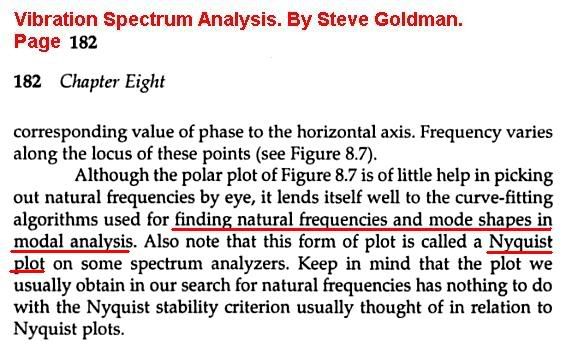
[4] What kind of information that we can obtain from Nyquist plot?

[5] If the coherence value is low, can we use Nyquist plot to help identifying the reasons that cause the low coherence value?

Thank you very much


Fig. 1. Experimental Setup. Hammer hits were repeatedly applied at 'X'.
Setup.jpg


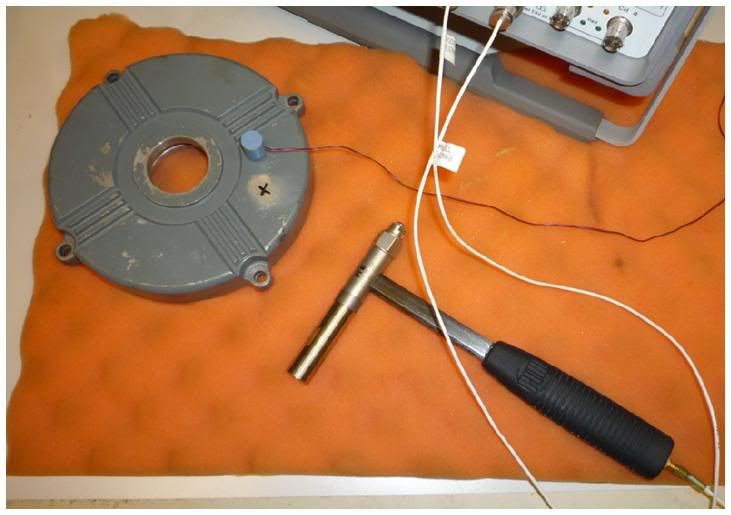
Fig. 2. Experimental Results. (Zoomable version is attached as 'Results.JPG').
Results.jpg
 
Replies continue below

Recommended for you

There are at least 3 peaks in that range, and there are probably 5 modes.

There is a peak close to 0 Hz which is probably the component bouncing on the foam.

Then there are the two obvious peaks between 1500 and 2000.

Those 2 peaks probably represent 4 modes as the part looks like has rotational symmetry and modes with radial nodal lines will exist in degenerate pairs. You would need 2 "references" (i.e. 2 accelerometer locations or 2 hammer hit locations) plus some modal analysis software to separate those.

As for the coherence, well the signals look good so I'm suprised by the big drop. Perhaps the response signal is not decaying as much as you think. Put an exponential window on it (but take it off again if it makes no difference to your coherence). Perhaps you are hitting too hard, or the foam is behaving non-linearly. The additional mass on the back of the hammer should not be needed, so remove it and try suspending the component on a couple of rubber bands instead.

M

--
Dr Michael F Platten
 
Hi Dr MikeyP,

Thanks for your advices. My background is electrical engineering and therefore I do not have much knowledge regarding modal analysis. I really hope that you will help and guide me to clear my doubts on impact hammer test.


You mentioned that "... there are probably 5 modes". Kindly refer to Figure 1. Would you please advise if the "5 modes" you mentioned include those shown in Figure 1?
Figure 1
circularmembrane.jpg


According to Rossing's book (Figure 2), the imaginary plot of Frequency Response Function (FRF) has a peak at resonance, while the real part goes through zero at resonance. Please refer to peak at 1986Hz. If we look at the real plot, it goes from negative to positive through zero at 1986Hz. Can I say that, at resonance, the real part can either go from positive to negative through zero, or from negative to positive through zero? Is this information (positive to negative through zero, or negative to positive through zero) sufficient to justify if it is a resonance peak?
Figure 2
rossingpage1129c.jpg


I found an article:
that suggests that the dips in my coherence plot might due to "antiresonance" regions. Based on your experience, do you agree with the author?


Goldman in his book (Figure 3) stated that "... The natural frequencies of the system are those points where the magnitude versus frequency plot peaks and the phase versus frequency plot shows a phase shift of approximately 90 degree for the force gauge/accelerometer instrumentation...". If you look at the phase plot of my FRF, the phase shift at 1822Hz and 1986Hz are approximately 180 degree and 130 degree, respectively, which are a lot more than 90 degree as claimed by Goldman. What do you reckon?
Figure 3
goldmanpage103-113.jpg


Again, according to Goldman's book (Figure 4), Nyquist plot can be use to help searching for natural frequencies. Would you please advise how can we use Nyquist plot to determine number of natural frequencies as well as the natural frequencies?
Figure 4
goldmanpage182.jpg
 
OK I didn't think it through.
Forget the degenerate mode stuff, it does not apply to your structure which is not perfectly rotationally symmetric.

1. You cannot ascertain mode shape from a single point measurement

2. There should be 2 rigid body modes close to 0 Hz these are the modes 1 and 2 on your figure 1.8. Your data does not have high enough resolution to resolve these as 2 peaks and your accelerometer probably doesn't work too well at these low frequencies.

3. There are 2 further modes (the 2 peaks in the 1800-2000 Hz region) which are probably modes 3 and 4 in fig 1.8. Again, you cannot be sure from a single point measurement.

4. All that stuff about 90 deg phase shifts and peaks in the imaginary component are all true ***if you only have one mode*** or if you have modes that are spaced well enough apart. You have 2 modes quite close together so one affects the other.

5. Almost no-one uses curve fits to the Nyquist plot any more for modal analysis (becasue it doesn't work very well when you have modes close together). These days it is all done using advanced multi-degree of freedom algorithms like Polyreference and PolyMAX.

M

--
Dr Michael F Platten
 
Status
Not open for further replies.
Back
Top