Eng-Tips is the largest engineering community on the Internet

Intelligent Work Forums for Engineering Professionals

Why am I seeing fluctuation in the displacements?

Status
Not open for further replies.

compe_ad

Civil/Environmental
Apr 20, 2022
71
0
6
US
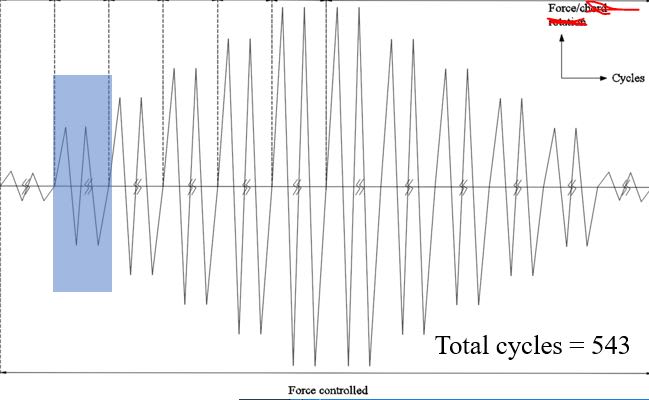
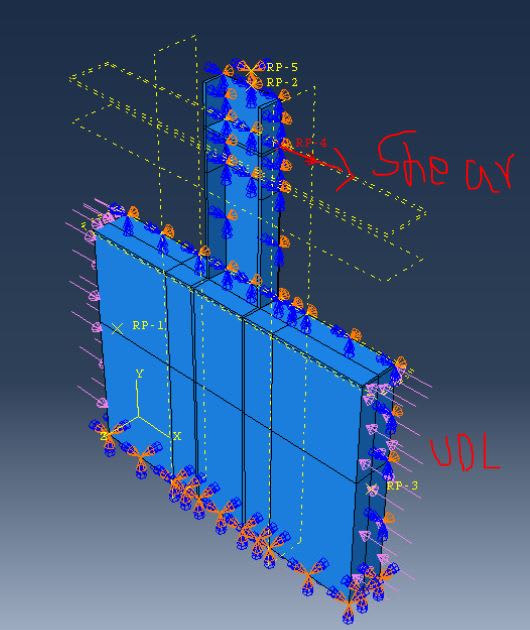
Hi everyone! I am working on ABAQUS model which consists of a reinforced concrete wall and has a cantilevered W-shaped steel beam embedded (see attached picture). The steel beam is subjected to a cyclic shear loading whereas the wall has its base fixed. I am using explicit analysis.

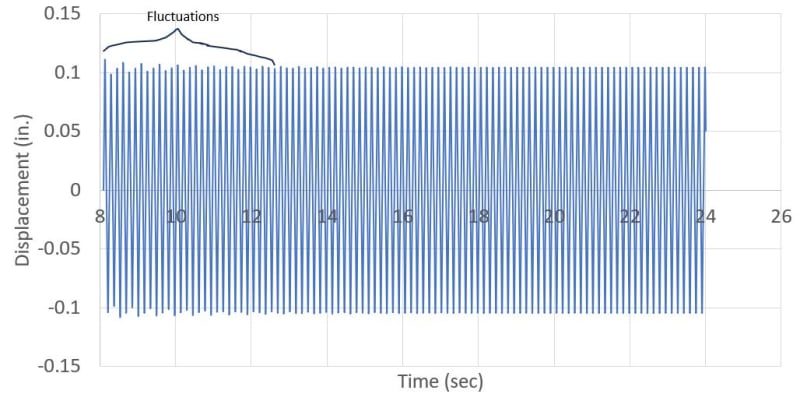
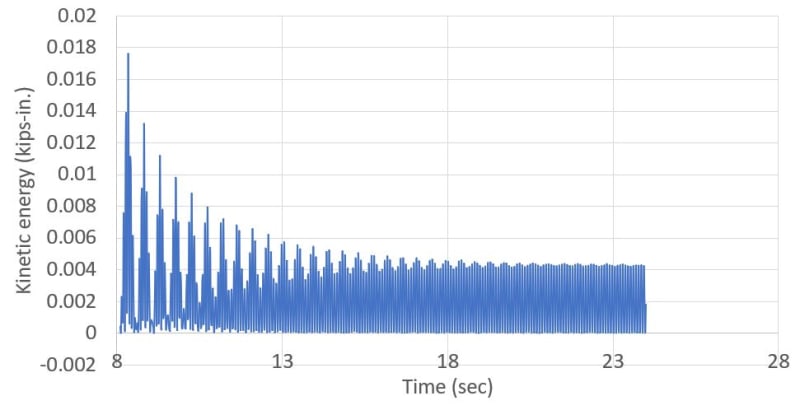
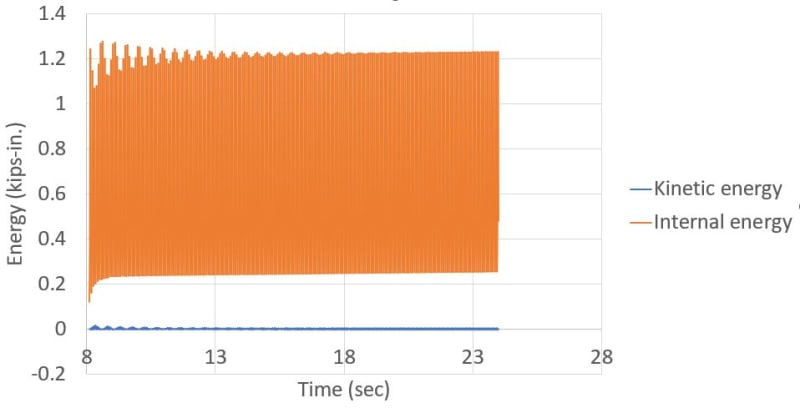
When I look at the beam's displacement at the loading point, I am seeing fluctuation at the beginning of the loading. The kinetic energy at those cycles is also fluctuating. However, the kinetic energy is very small as compared to internal energy of the model. Please refer to attached graphs.

Can anyone suggest me what is going on and how can I eliminate this to get the consistent displacements?

Thank you in advance.
model_a3ymbd.jpg
displacement_mdpcei.jpg
KE_qcqaqb.jpg
energy_ps6dph.jpg
 
Replies continue below

Recommended for you

It looks like initial transient response of a structure subjected to excitation, typical especially for quasi-static explicit dynamics. Try using the smooth step amplitude at the beginning and maybe add more steps to obtain a smoother response in all cycles.
 
Why are you not running it as a simple static analysis? Why the explicit dynamics? Is the shear load frequency that high that it can’t be considered quasi-static?
 
I was thinking about using the smooth step amplitude only for the initial excitation. The direct cyclic step would normally be the best for this kind of analysis unless the nonlinearities are so severe that Abaqus/Standard doesn’t converge no matter how hard you try.
 
Unless I am missing something obvious, running an explicit analysis for 24 seconds appears ridiculous; you want to be the millisecond scale, not seconds. How long is the analysis running and on how many cores?

Anyway, as suggested above, you need to use a smooth function at each discontinuity in the load profile. That would translate into 5 time points in the gray box. Any abrupt change in force => abrupt change in acceleration => relatively smoother change in velocity => relatively smoother change in displacement. As an alternative to a smooth step, you could pick any nice function to map a vector from 0 through 1 and back to 0 to a smooth output and then scale your load accordingly.

*********************************************************
Are you new to this forum? If so, please read these FAQs:

 
Status
Not open for further replies.
Back
Top