Hello,
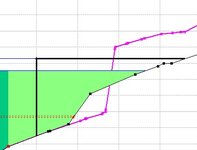
I'm working on a 1D HEC-RAS no rise analysis for a site, after construction (long story). Development included changes in the overbank at one XS, mostly cut. Pink is post-project on the graphic below.
The floodway run doesn't have a rise, as one would expect here. The 100-year run has a significantly decreased WSE for two XS upstream (0.1', 0.2') but slight increased WSE (0.04') at the third upstream XS.
In my mind, this is a "no rise" but the model needs a few changes to prove this.
Adding (interpolating) XS upstream seems to help but not sure how this is received on the FEMA end.
Thoughts?
w

