driftLimiter
Structural
Hey Coders/Engineers,
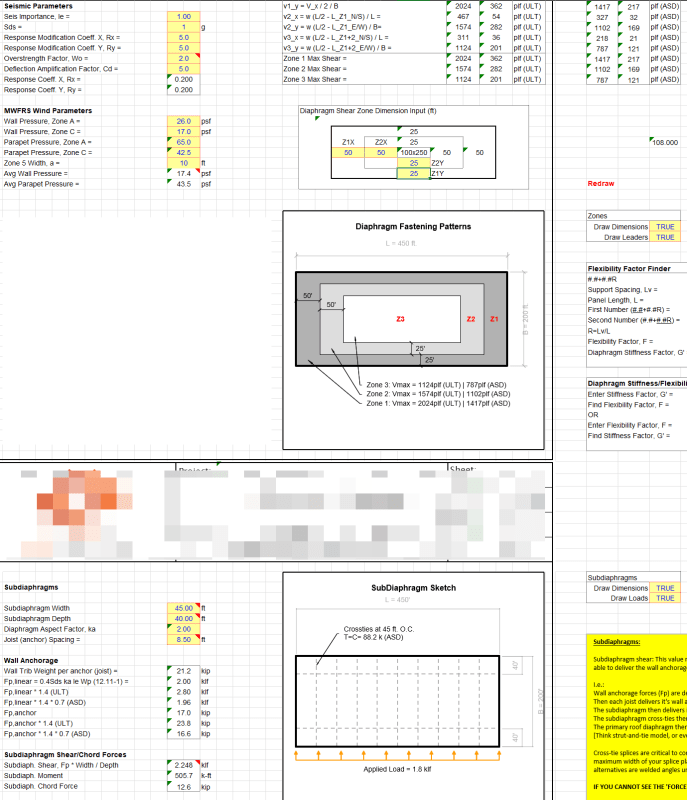
I have worked out a method to determine different zones for diaphragm strength independently in two directions.
Now I want to attempt to combine the results from each direction to develop a complete diaphragm zone plan.
1) I am pretty confident this can be done. I've seem some of the stuff @Agent666 does with python and I'm certain there is a way.
2) I am decent at python and pandas already.
I'd like to see if there is a good geometry library where I could first generate the regions from the data I have already calculated, then merge them together to make the graph.
Anyone know of a library that might simplify this task???
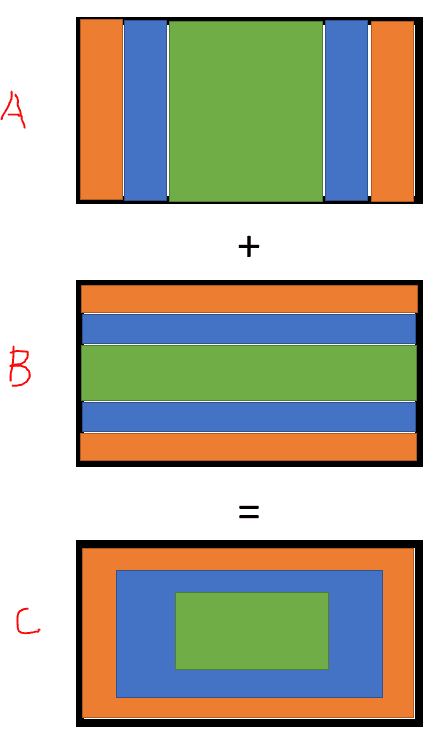
I have data sufficient to define the domain (in black) and I have coordinates of the transition regions between each color for each direction (A & B) from the image below. Just need an efficient way to merge the geometries that are similar to get figure C. I don't just want the graphical, I'd like to maintain the data of the solution as well.
I have worked out a method to determine different zones for diaphragm strength independently in two directions.
Now I want to attempt to combine the results from each direction to develop a complete diaphragm zone plan.
1) I am pretty confident this can be done. I've seem some of the stuff @Agent666 does with python and I'm certain there is a way.
2) I am decent at python and pandas already.
I'd like to see if there is a good geometry library where I could first generate the regions from the data I have already calculated, then merge them together to make the graph.
Anyone know of a library that might simplify this task???
I have data sufficient to define the domain (in black) and I have coordinates of the transition regions between each color for each direction (A & B) from the image below. Just need an efficient way to merge the geometries that are similar to get figure C. I don't just want the graphical, I'd like to maintain the data of the solution as well.
")