Eng-Tips is the largest engineering community on the Internet

Intelligent Work Forums for Engineering Professionals

ABAQUS BUCKLING RIKS ANALISYS

Status
Not open for further replies.

mikylangel

Industrial
May 1, 2024
8
0
0
ES
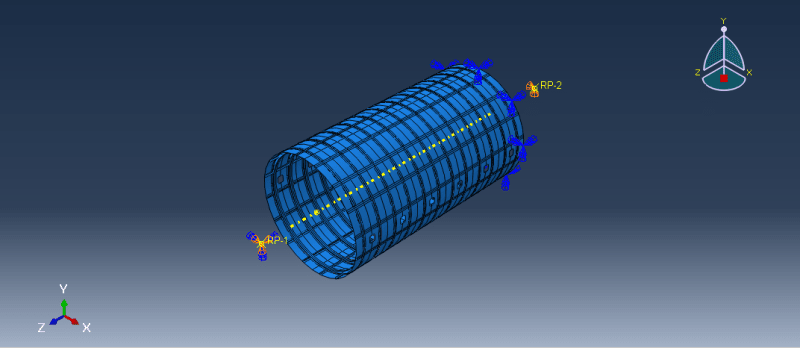
Hi, I am doing a riks analysis of a cylindrical fuselage with windows. I have applied contact interactions between the different parts, and I have applied a unit value load to a reference point, joining the displacements of that point to my figure. However, the LPF comes out constant, and does not come out as it should, since I understand that it should come out a maximum and then decrease. Does anyone know what is the reason for this?

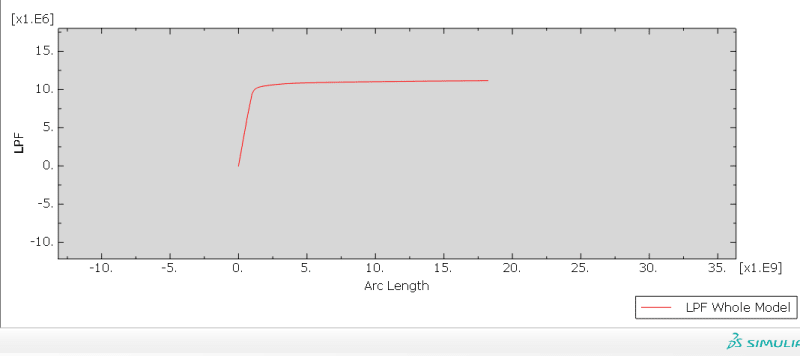
Attached is my LPF graph
captura_2_xqktgz.png
Captura_diqoew.png
 
Replies continue below

Recommended for you

LPF vs arc length plots are rather unintuitive. It would be better to plot force vs displacement for a representative region (reference point). Also, have a closer look at the deformation of the model in different stages of the analysis (animation will help).
 
Either request those variables as history output for the reference point before running the analysis or use Create XY Data --> ODB field output to extract them from that point. Then use Create XY Data --> Operate on XY data to combine those two variables into a single force vs displacement plot.
 
I have graphed lpf vs displacemnet and I still get the same thing. The problem is that the LPF comes out constantly, and it shouldn't. Any idea why I get constant?
 
I was thinking about applied force (or just reaction force) vs displacement. What does this plot look like ? Do you have any imperfections included in this analysis ?
 

I have not included imperfections, should i?. The applied force is of constant unit value at the reference point, shouldn't it continue to come out the same?
 
Imperfections are almost always included in Riks analyses so that you can get past the bifurcation. That's a very likely source of the problem here.

Riks procedure scales the applied loads (hence the additional LPF output) but you can still use the reaction forces to track them directly.
 
The easiest way is to add them as scaled mode shapes from linear buckling analysis preceding the nonlinear one. Check the documentation chapter "Introducing a Geometric Imperfection into a Model".
 
Status
Not open for further replies.
Back
Top