Continue to Site

Eng-Tips is the largest engineering community on the Internet

Intelligent Work Forums for Engineering Professionals

  • Congratulations cowski on being selected by the Eng-Tips community for having the most helpful posts in the forums last week. Way to Go!

ADC lag at specific values 5

Status
Not open for further replies.

mudandsnow

Electrical
Nov 12, 2015
77
Hello,

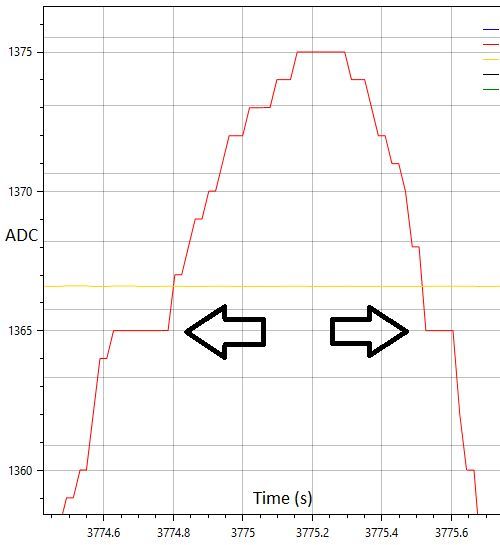
I have an odd issue and am welcome to any ideas. My ADC seems to lag at specific values and I would like to know why, or better yet, how to fix it. Lags are shown in attached pic.

Occurrence:
Unit 1 lags at ADC value 1638.
Unit 2 lags this at ADC value 1365.

Hardware:
Analog sensor ~10mV full scale
op amp - amplifies sensor output
ADC - ADS1110 reads output of op amp
MCU - reads ADC value
PC - reads and graphs MCU data


Replies continue below

Recommended for you

Signal is an oxygen sensor?

Looks like it, and the image file named o2Flats...

 
TI's website refers to latency issues, but in the microseconds.

Your flat spots appear to in be the milliseconds.

 
Good detective work there. It is an oxygen sensor, with analog output based on chemical reaction. I am assuming the sensor is not the cause because I find it hard to imagine a chemical reaction acting like that.

The lag time varies, in the pic there it is ~100ms, ~5 MCU samples and that is pretty typical.
 
Have a look here: Maxim The ABCs of ADCs...

Specifically:
Differential Nonlinearity (DNL) No Missing Codes
Figure 1a, the gap or delay in the red line

Perhaps looks like this sort of issue.

Maybe...

 
However, you also have an apparent "lag" or similar step behavior at the other end of the sinusoidal form, particularly near 19.04V. You mention an "MCU," so you need to perhaps explain the process by which this data is actually processed/transferred to the point where you got the data into the graphs. I can easily imagine there are little hiccups in the MCU processing that might create the semblance of what you are seeing. The fact that your "lags" are on the order of 5 MCU samples seems worth exploring.

TTFN (ta ta for now)
I can do absolutely anything. I'm an expert! faq731-376 forum1529
 
To me this looks a lot like a calculation problem in the software the converts the ADC binary into the value on the graph.
The resolution appears to be about 0.05 units on the graph's Y scale, making the flattened peak at 3772 sec look like normal data, if it weren't for the blips in the rest of the data.
To diagnose the software, we need the ADC resolution (bit rate) the sampling rate, and the formula that generates the output value.
Knowing the types of variables (floating, double, etc.) specified in the program would be important, too.


STF
 
Thank you all for the help.

VE1BLL, I had a feeling it might be something like that but I think every unit would have lags at the same points if that was the case.

IRstuff, these lags do happen at other values but the values I listed are the majority. Most of the MCU processing happens at peaks and valleys shown in the graph. While the lag is happening, the MCU still saves the data at the expected time intervals. In the data file when there is a lag, there are about 5 points with the same value. '5' is not fixed though, sometimes it's 3, sometimes it's 10.

itsmoked, chemical reaction causes sensor to output analog voltage which is amplified by op amp. Op amp output is read by ADC. ADC is read by MCU with I2C. MCU is read by PC over USB in real time. PC saves data in csv and graphs it. Csv shows multiple points with same values.
 
Sparweb, I changed the y-axis to show ADC values. Since the ADC values also lag I don't think the problem is in the conversion from ADC to oxygen percentage.

Attached new pic which is zoomed in on 3775s with y-axis = ADC value
Attached csv to show times and ADC values.


Are you doing the conversion in the micro, or after via post-processing? If inside the micro, what is the equation you're using? If the equation is long and complicated, I can see a timeslip happening during conversion at specific input values. I'm assuming you've already discounted missing codes.

Dan - Owner
URL]
 
o2Flats2-3775_dlj7vb.jpg


What triggers the MCU to actually read a new value from the ADC?

What paces/triggers the ADC to make each conversion?

Is this the only thing the ADC is measuring?

BTW what ADC is it?

Keith Cress
kcress -
 
Until you test with a known signal/voltage, I'd not rule out some physical phenomena (e.g. water desorption from the O2 sensor or similar chemical/physical processes).

" I am assuming the sensor is not the cause because I find it hard to imagine a chemical reaction acting like that."

I dunno, I can think of two, and it took me about 30 seconds.
 
Note that the data is actually not "lagging;" it's actually leading. If the result is supposed to be a smooth curve, then the MCU output is higher than it's supposed to be, which is likely neither an ADC nor MCU problem. However, repeated output values usually is indicative of a serious latency problem in data processing; the new result isn't available, so the processor outputs the last valid data. So, it's possible that the process controller is having problems.

ADC_Lag_l3w5n4.jpg


TTFN (ta ta for now)
I can do absolutely anything. I'm an expert! faq731-376 forum1529
 
What op amp are you using? This could be zero-crossing distortion (but not around zero if your power supply isn't bipolar). It would typically be somewhere around half the supply voltage (but could be anywhere between 25 ~ 75% or so). Each unit would be a bit different, may drift with temperature...
 
Rewritting last post since most of it disappeared:
Thanks again for the help everyone.

IRstuff, good catch, I missed that.

 
jimkirk, I am using ADS1110 for ADC.

I think you might be right. It does seem to be the op amp causing this.

Replaced the o2 sensor with a capacitor and charged it slowly to test different parts of the circuit today.
Replaced MCU with Arduino.
Added 2nd ADC to measure same net as ADS1110 (original ADC).

ADC1: ADS1110 being read by Arduino I2C.
ADC2: Arduino ADC
Signal: Voltage across cap. Voltage increases slowly over time.

Test 1:
Signal location: ADC input
Result: no flat spots in either ADC

Test 2:
Signal location: op amp input
Result: same flat spots in both ADCs
Result shown here:

Note: op amp output is connected to ADC input.

Conclusion: I think the op amp is causing the problem. Now to figure out how to solve the problem...


Status
Not open for further replies.

Part and Inventory Search

Sponsor