Eng-Tips is the largest engineering community on the Internet

Intelligent Work Forums for Engineering Professionals

ANSI C37.010-2016 Transformer/Motor X/R Curves QUERY 2

Status
Not open for further replies.

ThePunisher

Electrical
Nov 7, 2009
384
0
0
CA
Hi all,

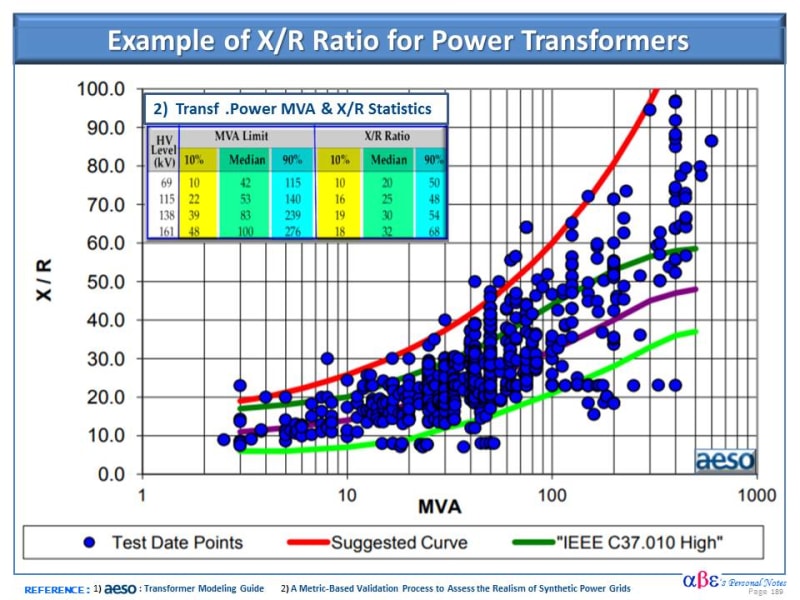
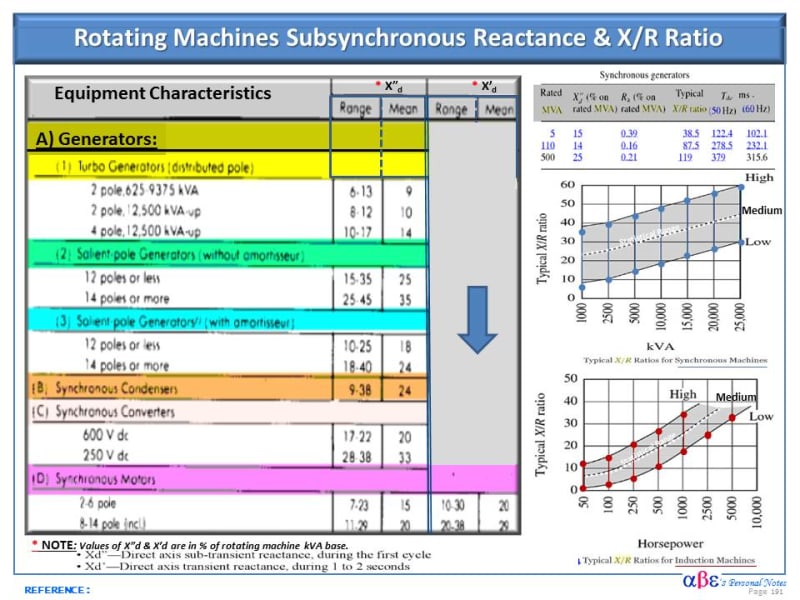
In ANSI C37.010-2016, typical X/R ratios for transformers, motors and generators, are indicated in Figure 30, Figure 31 and Figure 32 respectively Pages 89-90.

However the curves indicates "High, Medium and Low" and the standard did not specify what are the bases for using these curve classes. Can anyone provide guidance?

Thanks,
 
 https://files.engineering.com/getfile.aspx?folder=f06306c6-a30a-4cc1-af6e-d3196264fead&file=X_over_R_Query.jpg
Replies continue below

Recommended for you

ThePunisher,

The X/R published by the Standard are statistical data obtained from different equipment population from different manufacturers. Below is an example of statistical data for transformer the X/R deviation between the IEEE Std C37.010-2016 and other sources indicated in the illustration.

Unfortunately, there is not guidance to select an accurate value of the X/R ratio and is completely under the engineer jurisdiction to make the best assumption to continue with the design process.

Often the actual equipment data is not available at the time of the early engineering design phase. One way suggested to mitigate the uncertainty is suggested as follow:
[sub]1) Use the best engineering judgment and consult with prospective manufacturers combined with the team experience.
2) Perform a sensitivity analysis for a range with possible parameter variation.
3) Follow up went the equipment data became available and validate the original assumptions.
[/sub]


[sup]NOTE: Beware that the trend in the power industry is to use equipment with higher efficiency than similar units used in the past. It is recommended that the engineers should check how the traditional data will impact the X/R ratio.
[/sup]
>>>
X_over_R_Ratio_-_Statistic_Data_iyegyg.jpg
 
Transformer and other products will have impedance and load losses ( R depends on this) depending on utilities and individual units. Some utilities prefer a high impedance while others prefer low and some others medium range. So the range of curves.
 
Thank you and the part on the transformer is clear to me now.

This leaves my query on the X/R curves of the induction motors (and synchronous machines)...WHAT DO THE LOW, MEDIUM AND HIGH curves mean?
 
I am actually speculating that the Low, Medium and High curves for induction motors to be as below:

LOW - >50 HP but less than 250 HP
MEDIUM - > 250 HP but less than 1000 HP
HIGH - > 1000 HP

But I do not have any standards reference for it so I am guessing
 
Similarly to the transformer, the published data for the X/R ratio of rotating machines are statistical in nature and varies between range (min. - max.)for a given machine capacity in kVA or HP as obtained from representative manufacturers.

A distinction should be made considering the following:
• Synchronous machine: Can be represented by the sub-transient reactance direct axis reactance (X”d).

• Induction Motors: the sub-transient reactance is represented by the locked rotor reactance
[sub]
For >600V: X”d≈ 0.17pu x kVA[sub]base[/sub].​
For ≤600V: X”d ≈ 0.25pu x kVA[sub]base[/sub].​
[/sub]
[sub]It would be noted that the reactance is the dominant factor in the X/R ratio (X>>R). Also, the value of the X/R ratio will be impacted by the rotating machine parameters such as the number of poles, amortisseur, and other machine construction characteristics.[/sub]

>>>>
Rotating_Machine_Subsyncronous_Reactance_omgk7v.jpg
 
Status
Not open for further replies.
Back
Top