From ASCE 7-16 Section C26.5-1:
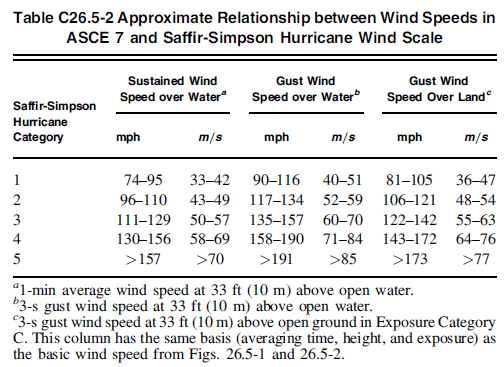
The wind speeds used in the Saffir-Simpson Hurricane Wind Scale are defined in terms of a sustained wind speed with a 1-min averaging time at 33 ft (10 m) over open water. The ASCE 7 standard by comparison uses a 3-s gust speed at 33 ft (10 m) above ground in Exposure C (defined as the basic wind speed, and shown in the wind speed map, Figs. 26.5-1 and 26.5-2). The sustained wind speed over water in Table C26.5-2 cannot be converted to a peak gust wind speed using the Durst curve of Fig. C26.5-1, which is only valid for wind blowing over open terrain (Exposure C). An approximate relationship between the wind speeds in ASCE 7 and the Saffir-Simpson scale, based on recent data which indicate that the sea surface roughness remains approximately constant for mean hourly speeds in excess of 67 mi∕h (30 m∕s), is shown in Table C26.5-2. The table provides the sustained wind speeds of the Saffir-Simpson Hurricane Wind Scale over water, equivalent-intensity gust wind speeds over water, and equivalent-intensity gust wind speeds over land. For a storm of a given intensity, Table C26.5-2 takes into consideration both the reduction in wind speed as the storm moves from over water to over land because of changes in surface roughness, and the change in the gust factor as the storm moves from over water to over land (Vickery et al 2009a; Simiu et al. 2007).
The question:
Suppose you are tasked with designing a structure to a specific "hurricane wind speed". Lets say 129 mph (1-min average Wind speed over water).
This structure is located in an exposure D zone.
Table C26.5-2 lists an approximate 3-sec gust over water of 157 mph, and an approximate 3-sec gust over land of 142 mph.
According to Section C26.5-1, Table C26.5-2 takes into consideration a reduction in surface roughness and gust factor as the given hurricane wind speeds transition from "over water" to "over land" (exposure C as noted in footnote c).
When calculating pressure qz, Should I:
1. Take the 3-sec gust speed over land (Exposure C) and apply Exposure D factors/coefficients
2. Take the 3-sec gust speed over water and apply Exposure C factors/coefficients
3. Take the 3-sec gust speed over water and apply Exposure D factors/coefficients
Is the 3-sec gust speed over water equivalent to Exposure D? I'm inclined to believe that it is not equivalent since foot note b in Table C26.5-2 does not mention it.
It is also worth noting that Section 26.5-1 states that 3-sec gust over water implements a constant surface roughness based on "recent data".
In my mind, taking the 3-sec gust speed over land, which is at a "basic wind level-Exposure C" and applying Exposure D factors/coefficients when calculating qz (option 1) seems no different than taking a basic wind speed from Figures 26.5-1 and 26.5-2 and applying Exposure D factors/coefficients when calculating qz. In the end ASCE 7-16, uses a wind pressure calculated on the basis of a 3-sec gust basic wind speed (Exposure C). It doesn't seem appropriate to plug a wind speed that is not at the "basic Exposure C" level into the pressure calculation.
Any input or thoughts?