Continue to Site

Eng-Tips is the largest engineering community on the Internet

Intelligent Work Forums for Engineering Professionals

  • Congratulations cowski on being selected by the Eng-Tips community for having the most helpful posts in the forums last week. Way to Go!

Bi-axial bending chart - concrete column 67

Pretty Girl

Structural
Nov 22, 2022
148
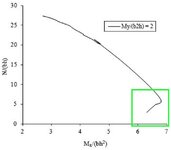
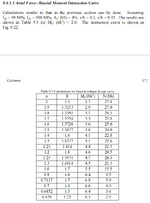
This is from "Reinforced concrete design to eurocodes" by prab bhat, page 371 and 372.
It has mentioned the it's for My/ (hb^2) = 2.

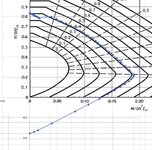
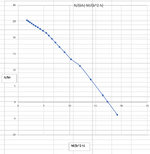
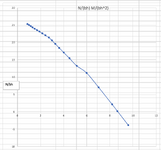
But I don't know how to reproduce with that ratio kept constant. So, I tried to create it with making the alpha and beta values at a constant ratio of 0.8 (beta = 0.8 alpha). Then I produced a chart.

Since I didn't reproduce the exact chart in the book, now I have another problem. I have got no reference chart to compare my chart with. Can anyone kindly help me find out if my chart is correct for the column dimensions and data I provided.

Are there any free software/ excel sheet to enter the column details mentioned below and compare it with my chart?

I'm concerned that my chart may not be correct as I don't see the part the book's chart have I have shown in the green rectangle below, when I produce my chart. I understand it cannot be the same chart, but if my chart is correct that "nose" like curve should also be in my chart isn't it.

1. Chart from the book
1734934729980.png
Untitled 5.jpg


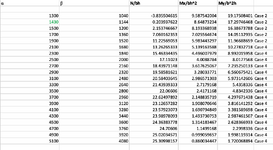
2. The chart I produced

This is a rectangular column, h = 2000 mm, b = 1000 mm. I maintained "beta/ alpha ratio = 0.8".
4 reinforcement bars, 1 bar each corner. Steel percentage 4% (So, 1% bh area for each bar).
40 mm distance from column surface to the centroid of r/f for each bar.
fck = 30 MPa, fcd = 20 MPa, fyk = 500 MPa, fyd = 434.7 MPa.
Screenshot 2024-12-23 at 5.14.55 pm.png

Screenshot 2024-12-23 at 5.14.33 pm.png
Screenshot 2024-12-23 at 5.14.21 pm.png
 
Last edited:
Replies continue below

Recommended for you

Thank you for the response.

Now I get it.
What I still don't get is, how their chart is almost horizontal after the pure compression occurs. If they followed Eurocodes, there should be a drop as it caps at 0.00175 or 0.002. If their line is perfectly horizontal, we could have guessed they have just ignored the concentric behaviour. But it's not perfectly horizontal, that means they have not ignored concentric behaviour. But they get almost horizontal line and i get a drop after pure compression. So, they are following different type of calculation after the pure compression. Wonder what is more precise.
Have another look at Fig. 6.1 in the code:
- When the bottom face is in tension the top face strain stays constant at 0.0035
- When the NA reaches the bottom face the top face strain is still 0.0035, the bottom face is zero, and point C is 0.00175 (or 0.002 for the parabolic stress block).
- For any further increase in axial load the strain at C stays constant, the top face strain gradually reduces and the bottom face strain continues to increase.
- Under uniform compression the strain across the full section is constant at 0.00175 or 0.002.
- There is never a step change in the strain at any point, so there is never a step change in the moment capacity.

I am not sure what you mean by ignoring concentric behaviour. The short straight section at the top left end of the lines on the chart looks perfectly horizontal to me. It might be associated with the minimum eccentricity of the load, but the values don't match my calculations, so I'm not sure.

@IDS

Can you please confirm this is only for steel strain calculations. As you said earlier we don't have to calculate the concrete strains as we take the concrete strains as uniform throughout the simplified compression block. So, I believe this is only for the steel?

It's bit confusing, in a previous page you said we just take N = area * 22.667 N/mm2, etc as we use simplified stress block. Now you're saying to calculate it using the point C. I believe the point c refers to the depth where 0.00175 occurs. Now that's a different way of calculating concrete stress than you previously guided me to do.

Further, I don't think Eurocode charts in that book are made through using these point C etc or any interpolation, there must be something else that smoothes out the line at the end. They seems to have used the simplified methods and I can't figure out the last bit of the chart.

I feel like your chart isn't following Eurocode and it's wrong. In eurocode, there isn't any smoothing mechanism as I see, they just ask us to recalculate by replacing the top fibre with 0.00175 and NA as zero strain, when we enter the pure compression.
Then there must be a drop like I have (as it's unavoidable if you strictly followed the eurocode). So in that sense I see my chart is the accurate one. I guess the book is also wrong and they didn't even calculate after the pure compression and seems to have decided just to put a straight line. What do you think?

Screenshot 2025-03-22 at 9.12.04 pm.jpg
 
Last edited:
@IDS

Can you please confirm this is only for steel strain calculations. As you said earlier we don't have to calculate the concrete strains as we take the concrete strains as uniform throughout the simplified compression block. So, I believe this is only for the steel?

It's bit confusing, in a previous page you said we just take N = area * 22.667 N/mm2, etc as we use simplified stress block. Now you're saying to calculate it using the point C. I believe the point c refers to the depth where 0.00175 occurs. Now that's a different way of calculating concrete stress than you previously guided me to do.

Further, I don't think Eurocode charts in that book are made through using these point C etc or any interpolation, there must be something else that smoothes out the line at the end. They seems to have used the simplified methods and I can't figure out the last bit of the chart.

I feel like your chart isn't following Eurocode and it's wrong. In eurocode, there isn't any smoothing mechanism as I see, they just ask us to recalculate by replacing the top fibre with 0.00175 and NA as zero strain, when we enter the pure compression.
Then there must be a drop like I have (as it's unavoidable if you strictly followed the eurocode). So in that sense I see my chart is the accurate one. I guess the book is also wrong and they didn't even calculate after the pure compression and seems to have decided just to put a straight line. What do you think?

View attachment 6942
Yes, the strains are just for the calculation of the steel stresses. The stress for the rectangular stress block is defined in the code, and it doesn't say anywhere it should be reduced for sections with uniform compression.

The code also does not say there should be a jump in the strain at any stage. It says that plane sections remain plane, which means the strain will always be a straight line from the Neutral Axis to the compression face. That means the strain at the top face transitions smoothly from 0.0035 when the NA is at the bottom face to 0.00175 when the NA is at infinity. Over that range, the strain at C remains constant at 0.00175, and the strain at the bottom face increases from 0 to 0.00175.

@IDS
Thank you for the response.
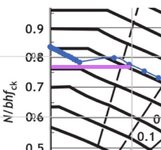
Yes you're right. They don't say that there should be a jump (or dip in my case). However, I still believe that dip/drop should be the limit of the axial force in the pure compression regardless of the method used like point C etc as the strain limit in pure compression is either 0.00175 or 0.002. So, if the method with point C etc meant to join the lowest N in the pure compression, the line in the mid range must be bit below than that. So, I don't understand how yours match with the standard chart. I feel like the standard chart didn't apply 0.00175 limit. If they did, it should end up having the lowest dip I have (It may not appear like a dip but still their horizontal line should lie on the lowest point I have). No matter the method they used, they can't escape the 0.00175 limit in the pure compression region. Since they have line above my lowest axial load in pure compression, haven't they over estimated the capacity in the pure compression? and your chart is also above my lowest N in pure compression, that means you have also over estimated the capacity. What do you think?

I meant shouldn't it be below my lowest N if they applied the limit 0.00175 or 0.002, regardless of the method used? If not, how come if they are not over estimating the capacity by drawing a line above it? Don't you think they are over estimating the capacity in the pure compression?

Screenshot 2025-03-23 at 1.27.16 pm.jpg
 
Last edited:
@IDS
Thank you for the response.
Yes you're right. They don't say that there should be a jump (or dip in my case). However, I still believe that dip/drop should be the limit of the axial force in the pure compression regardless of the method used like point C etc as the strain limit in pure compression is either 0.00175 or 0.002. So, if the method with point C etc meant to join the lowest N in the pure compression, the line in the mid range must be bit below than that. So, I don't understand how yours match with the standard chart. I feel like the standard chart didn't apply 0.00175 limit. If they did, it should end up having the lowest dip I have (It may not appear like a dip but still their horizontal line should lie on the lowest point I have). No matter the method they used, they can't escape the 0.00175 limit in the pure compression region. Since they have line above my lowest axial load in pure compression, haven't they over estimated the capacity in the pure compression? and your chart is also above my lowest N in pure compression, that means you have also over estimated the capacity. What do you think?

I meant shouldn't it be below my lowest N if they applied the limit 0.00175 or 0.002, regardless of the method used? If not, how come if they are not over estimating the capacity by drawing a line above it? Don't you think they are over estimating the capacity in the pure compression?

View attachment 6977
What do you understand by "pure compression"? My understanding is that the compression strain is constant across the section, so the bending moment is zero. Under that condition the strain limit applies across the full section. When the NA is at the base of the section the strain distribution is as shown in Fig. 6.1, and in between those two conditions the strain at the top face and bottom face varies smoothly, with the strain at point C staying constant. That doesn't give rise to jump in the axial capacity.
 
What do you understand by "pure compression"? My understanding is that the compression strain is constant across the section, so the bending moment is zero. Under that condition the strain limit applies across the full section. When the NA is at the base of the section the strain distribution is as shown in Fig. 6.1, and in between those two conditions the strain at the top face and bottom face varies smoothly, with the strain at point C staying constant. That doesn't give rise to jump in the axial capacity.

Is there any full calculation example of what you're saying, that shows the calculation of N and M in that pure compression? I don't get how to calculate that. The steps you mentioned doesn't make sense to me. So I need to see an example calculation, so I can understand what actually happens.
 
Is there any full calculation example of what you're saying, that shows the calculation of N and M in that pure compression? I don't get how to calculate that. The steps you mentioned doesn't make sense to me. So I need to see an example calculation, so I can understand what actually happens.
Full calculation? Sure:

Force = Concrete stress x concrete area + (Es x 0.00175 - concrete stress) x steel area.

All forces are symmetrical about the concrete centroid, so moment = 0.
 
@IDS

Isn't that just replacing the 0.0035 compressive fibre with 0.00175 and just calculating as normal.
 
@IDS

Isn't that just replacing the 0.0035 compressive fibre with 0.00175 and just calculating as normal.
Yes, why do you think you need to do anything else? The whole section has the same strain and stress, so just multiply by the areas to get the force.
 
Yes, why do you think you need to do anything else? The whole section has the same strain and stress, so just multiply by the areas to get the force.
@IDS
Thank you for the response.
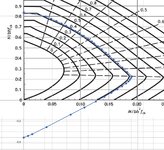
Now it looks way better. But we're just force feeding the 0.00175 and we're over estimating the inbetween points in the pure compression. As I see it automatically skips the fine variations of the actual axial force and just connects with the position where M = 0.

Screenshot 2025-03-23 at 5.37.10 pm.jpg
 
@IDS
Thank you for the response.
Now it looks way better. But we're just force feeding the 0.00175 and we're over estimating the inbetween points in the pure compression. As I see it automatically skips the fine variations of the actual axial force and just connects with the position where M = 0.

View attachment 6988
No, we aren't over-estimating the in-between points. The curve if you did the calculation would be slightly convex, so a straight line would be slightly conservative, but the difference is very small.

You only get the step in the line in your graph because you insist on reducing the strain at the compression face down to 0.00175 as soon as the NA is outside the section,
but the code doesn't say you should do that. For instance, if the NA was 250 mm below the bottom face, with a 500 mm deep section, the strains would be:
D Strain
0 0.002625
0.25 0.00175
0.5 0.000875
0.75 0

@IDS
Thank you for the response.
I posted the same issue on some other websites to get it confirmed. I got some response from one of them saying that's not correct and 6.1 (5) is not applicable to columns. However, I don't get why it isn't related to columns as it's also a compression member.

You need to revisit your assumptions on limit strain in the near pure compression region.

In the near pure compression region where the neutral axis lies outside the section the ultimate limit strain is neither 0.00175 or 0.0035 but some intermediate value. The book you reference for the charts provides diagrams for this and guidance on interpolation of values. The clause 6.1(5) you include is a corollary of this general philosophy to simplify analysis of flanged beams etc. and you should discard it for this.

The reason the Eurocode permits different limit strains for concrete crushing in flexure and crushing in pure compression comes from the fact that in flexure, after the extreme fibre begins to plastically deform additional capacity can be mobilised as the neutral axis deepens. This is not the case for a member in pure compression which has failed if the entire section is plastic.
 
@IDS
Thank you for the response.
I posted the same issue on some other websites to get it confirmed. I got some response from one of them saying that's not correct and 6.1 (5) is not applicable to columns. However, I don't get why it isn't related to columns as it's also a compression member.
Frankly I am not sure how cl. 6.1(5) is supposed to be applied, but since we are not analysing a flanged beam it doesn't seem relevant anyway. There seems to be general agreement, both in the post above and in the other thread you started here, that as the NA goes from just outside the section to infinity (i.e. to uniform compression), the strain at the top face gradually reduces from 0.0035 to 0.00175, which will generate a smooth curve in the interaction diagram. In my calculations I have approximated that smooth curve with a straight line.
 
I'm not sure about eurocode, but there is a maximum Pr you can provide for a column so that's where the flat line comes from; you won't achieve a flat curve by doing stress/strain compatibility here. When I created my interaction diagram for circular columns I just overwrote any values where Pr was greater than my Pr,max. The CSA Pr,max is = (0.2+0.002h)*Pro <=0.8Pro.
 
Frankly I am not sure how cl. 6.1(5) is supposed to be applied, but since we are not analysing a flanged beam it doesn't seem relevant anyway. There seems to be general agreement, both in the post above and in the other thread you started here, that as the NA goes from just outside the section to infinity (i.e. to uniform compression), the strain at the top face gradually reduces from 0.0035 to 0.00175, which will generate a smooth curve in the interaction diagram. In my calculations I have approximated that smooth curve with a straight line.

@IDS Thank you for the response.

ChatGpt says (yeah, it's not a reliable source I know, should not even mention it here), something like we should use N = 0.00175 * x (d/x) , and it says we should consider each r/f bar's pure compression state, that means once NA moves away from the centroid of each bar, that bar should be considered for "0.00175 calculation" etc. Could be total bs, but could be something that we might need to look into? I tried that, it goes to that horizontal line and stops there, but the midrange line is bit lower than the chart. May be I'm doing it wrong.

It says something like, x = neutral axis to extreme fibre length, d = each r/f centroid to extreme fibre length. That means it says we should calculate for each level of r/f bar, not only when the column's section is in pure compression.

It further confirms if I replace the compression fibre of 0.0035 with 0.00175 it will end up at the same spot at M=0, but says it's a shortcut. So, it might be saying something meaningful but I still can't get the chart correct.
 
I'm not sure about eurocode, but there is a maximum Pr you can provide for a column so that's where the flat line comes from; you won't achieve a flat curve by doing stress/strain compatibility here. When I created my interaction diagram for circular columns I just overwrote any values where Pr was greater than my Pr,max. The CSA Pr,max is = (0.2+0.002h)*Pro <=0.8Pro.

@EngDM
Thank you for the response,

The problem is, it even might not be a horizontal line at the end in that chart. If it is we can assume they applied a hard cap and rest of the line appeared perfect horizontal line. I believe, we actually did strain compatibility in the mid range up until pure compression. As IDS suggested, we simply replaced the 0.0035 with 0.00175 after in pure compression, I believe it's also acceptable as it ends at the exact same spot when M = 0.

As you say, if they used strain compatibility, the chart could have been more rounded than horizontal line, so I feel you're right, they might have actually applied a hard cap after pure compression. That makes IDS's method accurate and acceptable as I see.
 
Last edited:
@EngDM
Thank you for the response,

The problem is, it even might not be a horizontal line at the end in that chart. If it is we can assume they applied a hard cap and rest of the line appeared perfect horizontal line. I believe, we actually did strain compatibility in the mid range up until pure compression. As IDS suggested, we simply replaced the 0.0035 with 0.00175 after in pure compression, I believe it's also acceptable as it ends at the exact same spot when M = 0.

As you say, if they used strain compatibility, the chart could have been more rounded than horizontal line, so I feel you're right, they might have actually applied a hard cap after pure compression. That makes IDS's method accurate and acceptable as I see.
We are starting to go round in circles here, but:

As IDS suggested, we simply replaced the 0.0035 with 0.00175 after in pure compression, I believe it's also acceptable as it ends at the exact same spot when M = 0.
It's "acceptable" in the sense that it will always be conservative, and will give the correct result when M = 0, but I don't see the point of doing complex calculations with a lower than required limit on the strain, when a straight line interpolation is also conservative and more accurate.

The other (more important) point is that you aren't allowing for the specified minimum load eccentricity, which does in effect limit the maximum axial load to a hard cap.
 
We are starting to go round in circles here, but:


It's "acceptable" in the sense that it will always be conservative, and will give the correct result when M = 0, but I don't see the point of doing complex calculations with a lower than required limit on the strain, when a straight line interpolation is also conservative and more accurate.

The other (more important) point is that you aren't allowing for the specified minimum load eccentricity, which does in effect limit the maximum axial load to a hard cap.

@IDS
Thank you for the response.

I have learned so much through the contributions from you and others in this thread. I believe now it's time to move into something else, but a related one. Will post a new thread for that.

Thank you so much 🤩
 

Part and Inventory Search

Sponsor