Continue to Site

Eng-Tips is the largest engineering community on the Internet

Intelligent Work Forums for Engineering Professionals

  • Congratulations cowski on being selected by the Eng-Tips community for having the most helpful posts in the forums last week. Way to Go!

Bi-axial bending chart - concrete column 67

Pretty Girl

Structural
Nov 22, 2022
148
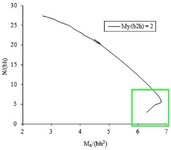
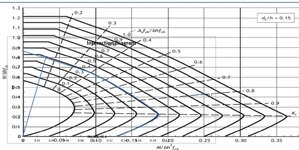
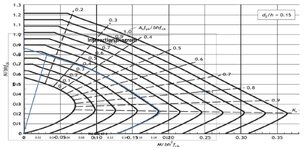
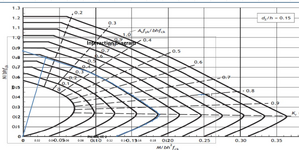
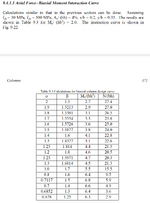
This is from "Reinforced concrete design to eurocodes" by prab bhat, page 371 and 372.
It has mentioned the it's for My/ (hb^2) = 2.

But I don't know how to reproduce with that ratio kept constant. So, I tried to create it with making the alpha and beta values at a constant ratio of 0.8 (beta = 0.8 alpha). Then I produced a chart.

Since I didn't reproduce the exact chart in the book, now I have another problem. I have got no reference chart to compare my chart with. Can anyone kindly help me find out if my chart is correct for the column dimensions and data I provided.

Are there any free software/ excel sheet to enter the column details mentioned below and compare it with my chart?

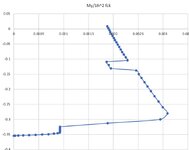
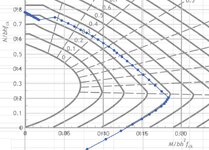
I'm concerned that my chart may not be correct as I don't see the part the book's chart have I have shown in the green rectangle below, when I produce my chart. I understand it cannot be the same chart, but if my chart is correct that "nose" like curve should also be in my chart isn't it.

1. Chart from the book
1734934729980.png
Untitled 5.jpg


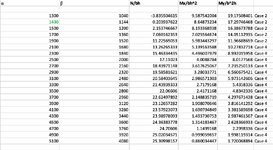
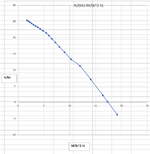
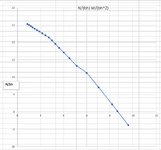
2. The chart I produced

This is a rectangular column, h = 2000 mm, b = 1000 mm. I maintained "beta/ alpha ratio = 0.8".
4 reinforcement bars, 1 bar each corner. Steel percentage 4% (So, 1% bh area for each bar).
40 mm distance from column surface to the centroid of r/f for each bar.
fck = 30 MPa, fcd = 20 MPa, fyk = 500 MPa, fyd = 434.7 MPa.
Screenshot 2024-12-23 at 5.14.55 pm.png

Screenshot 2024-12-23 at 5.14.33 pm.png
Screenshot 2024-12-23 at 5.14.21 pm.png
 
Last edited:
Replies continue below

Recommended for you

@IDS

Can you please elaborate a bit, how you did it? I mean, bit more information in simple manner would be useful. Did you set the NA parallel to y axis (90 degrees)? and after that did you divide Mx moment with bh^2 fck? etc? I mean you only take one axis for consideration? Can you please provide the steps of how you did it.

About the diagram source, I just got a screenshot of a random youtube video. Thank you for providing a more clear diagram source.
 
Last edited:
@IDS

Can you please elaborate a bit, how you did it? I mean, bit more information in simple manner would be useful. Did you set the NA parallel to y axis (90 degrees)? and after that did you divide Mx moment with bh^2 fck? etc? I mean you only take one axis for consideration? Can you please provide the steps of how you did it.

About the diagram source, I just got a screenshot of a random youtube video. Thank you for providing a more clear diagram source.
The NA is set parallel to the X axis. Otherwise, exactly as you said :)

The charts are for uniaxial bending about one axis, so the only other changes from previous calcs were setting the bar centres so that d2/h = 0.15, and setting the bar diameter so that Asfyk/bhfck = 0.2.

One other thing, I set fck = 40 MPa and fyk = 500 (as in the example in the book).

Note that the biaxial calculation in the book uses the simplified method given in the code, i.e. finding Mx and My for uniaxial loading, then combining them using the code formula. They don't do an analysis using a rotated cross section, so you shouldn't expect the charts to work for a section under biaxial loading.

@IDS
Thank you for the clarification.

I'm confused why did you set Asfyk/bhfck = 0.2 when you calculate, and compared your result with Asfyk/bhfck = 0.4 line in the diagram?
So, you used 4 bars and each bar is 25 mm diameter?

Or you used 4 bars with 35 mm diameter (for Asfyk/bhfck = 0.4)?

Further, this is not that useful in biaxial situations as you mentioned. So, is there any other standard charts out there to compare out diagram so we can confirm our diagram is accurate?

may be there are some standard set of other biaxial charts? with varying angle of NA?

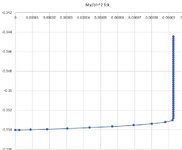
When I change it to close to 5 degrees NA angle (if it gets close to zero, it's even worse it seems). It becomes very strange

bh^2 = 62500000
fck = 40
bh^2 fck = 2500000000
bh^2 fck*10^-6 = 2500

Mx/bh^2 fck = Mx/2500
example: 208.76 kNm / 2500 = 0.083


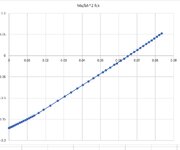
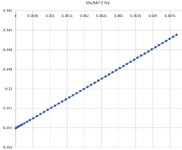
Mx without dividing by bh^2 fck is also shows that exact line pattern at 5 degrees. That means, the way I calculate is wrong somewhere, although I got similar results as yours earlier for Mx and My.


Screenshot 2025-03-14 at 5.54.03 pm.jpg

Screenshot 2025-03-14 at 6.54.44 pm.jpg


MxMx/bh^2 fck
0.000141971​
5.67883E-08​
0.127429845​
5.09719E-05​
0.508296359​
0.000203319​
1.140465012​
0.000456186​
2.021801273​
0.000808721​
3.150170611​
0.001260068​
4.523438496​
0.001809375​
6.139470397​
0.002455788​
7.996131783​
0.003198453​
10.09128812​
0.004036515​
12.42280489​
0.004969122​
14.94513556​
0.005978054​
17.46744228​
0.006986977​
19.9675143​
0.007987006​
22.44535162​
0.008978141​
24.90095426​
0.009960382​
27.33432219​
0.010933729​
29.74545543​
0.011898182​
32.13435398​
0.012853742​
34.50101784​
0.013800407​
40.413447​
0.016165379​
47.20764146​
0.018883057​
56.56760123​
0.02262704​
66.66532631​
0.026666131​
76.08981669​
0.030435927​
84.91807238​
0.033967229​
93.21609337​
0.037286437​
101.0418797​
0.040416752​
108.4424313​
0.043376973​
115.4597482​
0.046183899​
122.1308304​
0.048852332​
128.4846779​
0.051393871​
132.6042907​
0.053041716​
138.4066689​
0.055362668​
143.9668123​
0.057586725​
147.3557211​
0.058942288​
152.4843951​
0.060993758​
157.4218345​
0.062968734​
162.1800391​
0.064872016​
166.7720091​
0.066708804​
171.2087444​
0.068483498​
175.4992449​
0.070199698​
179.6525108​
0.071861004​
183.676542​
0.073470617​
187.5783385​
0.075031335​
191.3659003​
0.07654636​
195.0432274​
0.078017291​
198.6173198​
0.079446928​
202.0931775​
0.080837271​
205.4758005​
0.08219032​
208.7681889​
0.083507276​
 
Last edited:
@IDS
Thank you for the clarification.

I'm confused why did you set Asfyk/bhfck = 0.2 when you calculate, and compared your result with Asfyk/bhfck = 0.4 line in the diagram?
So, you used 4 bars and each bar is 25 mm diameter?

Or you used 4 bars with 35 mm diameter (for Asfyk/bhfck = 0.4)?

Further, this is not that useful in biaxial situations as you mentioned. So, is there any other standard charts out there to compare out diagram so we can confirm our diagram is accurate?

may be there are some standard set of other biaxial charts? with varying angle of NA?

When I change it to close to 5 degrees NA angle (if it gets close to zero, it's even worse it seems). It becomes very strange

bh^2 = 62500000
fck = 40
bh^2 fck = 2500000000
bh^2 fck*10^-6 = 2500

Mx/bh^2 fck = Mx/2500
example: 208.76 kNm / 2500 = 0.083


Mx without dividing by bh^2 fck is also shows that exact line pattern at 5 degrees. That means, the way I calculate is wrong somewhere, although I got similar results as yours earlier for Mx and My.


View attachment 6537

View attachment 6544


MxMx/bh^2 fck
0.000141971​
5.67883E-08​
0.127429845​
5.09719E-05​
0.508296359​
0.000203319​
1.140465012​
0.000456186​
2.021801273​
0.000808721​
3.150170611​
0.001260068​
4.523438496​
0.001809375​
6.139470397​
0.002455788​
7.996131783​
0.003198453​
10.09128812​
0.004036515​
12.42280489​
0.004969122​
14.94513556​
0.005978054​
17.46744228​
0.006986977​
19.9675143​
0.007987006​
22.44535162​
0.008978141​
24.90095426​
0.009960382​
27.33432219​
0.010933729​
29.74545543​
0.011898182​
32.13435398​
0.012853742​
34.50101784​
0.013800407​
40.413447​
0.016165379​
47.20764146​
0.018883057​
56.56760123​
0.02262704​
66.66532631​
0.026666131​
76.08981669​
0.030435927​
84.91807238​
0.033967229​
93.21609337​
0.037286437​
101.0418797​
0.040416752​
108.4424313​
0.043376973​
115.4597482​
0.046183899​
122.1308304​
0.048852332​
128.4846779​
0.051393871​
132.6042907​
0.053041716​
138.4066689​
0.055362668​
143.9668123​
0.057586725​
147.3557211​
0.058942288​
152.4843951​
0.060993758​
157.4218345​
0.062968734​
162.1800391​
0.064872016​
166.7720091​
0.066708804​
171.2087444​
0.068483498​
175.4992449​
0.070199698​
179.6525108​
0.071861004​
183.676542​
0.073470617​
187.5783385​
0.075031335​
191.3659003​
0.07654636​
195.0432274​
0.078017291​
198.6173198​
0.079446928​
202.0931775​
0.080837271​
205.4758005​
0.08219032​
208.7681889​
0.083507276​
I'm confused why did you set Asfyk/bhfck = 0.2 when you calculate, and compared your result with Asfyk/bhfck = 0.4 line in the diagram?
So, you used 4 bars and each bar is 25 mm diameter?

Or you used 4 bars with 35 mm diameter (for Asfyk/bhfck = 0.4)?
My mistake. I had 4 bars with 36 mm diameter.

I agree the charts aren't particularly useful for biaxial loading.

I don't know of any biaxial charts, and if there are any they would be likely to be based on the simplified method, rather than analysis with a rotated NA. Note that the simplified method doesn't agree very well with the detailed analysis. See our previous discussion here: https://www.eng-tips.com/viewthread.cfm?qid=508170, and also my blog post: simplified-bi-axial-bending

I'll have a look at my results with different angles and reply separately on that.

@IDS
Thank you for the response and the links.

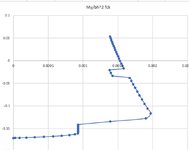
I updated with 36 mm dia r/f and 57 mm cover to come up with d'/h = 0.15. For the 5 degrees NA to x axis, I get the following. I went through the calculation. It also seems ok. It's possible to get inaccurate when it's very close to zero.

Even with detailed analysis more precise, the fact that my charts being totally different at this 5 degrees NA, compared to simplified standard method is very strange.

Please provide some comparisons and insights so I can rectify this.

Screenshot 2025-03-14 at 9.25.07 pm.jpg

Screenshot 2025-03-14 at 9.25.26 pm.jpg


N​
N/bh fck​
Mx​
Mx/bh^2 fck​
-1770.2204​
-0.3540441​
0.00014275​
5.7102E-08​
-1769.707​
-0.3539414​
0.12813093​
5.1252E-05​
-1768.1652​
-0.353633​
0.51108496​
0.00020443​
-1765.5953​
-0.3531191​
1.14670395​
0.00045868​
-1761.9976​
-0.3523995​
2.03282973​
0.00081313​
-1757.3719​
-0.3514744​
3.16730416​
0.00126692​
-1751.7184​
-0.3503437​
4.5479691​
0.00181919​
-1745.0368​
-0.3490074​
6.17266639​
0.00246907​
-1737.3274​
-0.3474655​
8.03923788​
0.0032157​
-1728.59​
-0.345718​
10.1455254​
0.00405821​
-1718.8248​
-0.343765​
12.4893709​
0.00499575​
-1708.2064​
-0.3416413​
15.024965​
0.00600999​
-1697.4989​
-0.3394998​
17.5604118​
0.00702416​
-1686.7913​
-0.3373583​
20.0733779​
0.00802935​
-1676.0838​
-0.3352168​
22.5638633​
0.00902555​
-1665.3762​
-0.3330752​
25.0318679​
0.01001275​
-1654.6687​
-0.3309337​
27.4773918​
0.01099096​
-1643.9611​
-0.3287922​
29.900435​
0.01196017​
-1633.2536​
-0.3266507​
32.3009975​
0.0129204​
-1622.546​
-0.3245092​
34.6790793​
0.01387163​
-1563.9425​
-0.3127885​
45.4166803​
0.01816667​
-1500.5129​
-0.3001026​
56.9758007​
0.02279032​
-1401.2844​
-0.2802569​
74.7774403​
0.02991098​
-1298.3598​
-0.259672​
93.2035992​
0.03728144​
-1203.1203​
-0.2406241​
110.262277​
0.04410491​
-1114.6417​
-0.2229283​
126.115475​
0.05044619​
-1032.1471​
-0.2064294​
140.899192​
0.05635968​
-954.9696​
-0.1909939​
154.729428​
0.06189177​
-882.53904​
-0.1765078​
167.707183​
0.06708287​
-814.36649​
-0.1628733​
179.916457​
0.07196658​
-750.02394​
-0.1500048​
191.433251​
0.0765733​
-689.14239​
-0.1378285​
202.322564​
0.08092903​
-654.46884​
-0.1308938​
208.602397​
0.08344096​
-599.57428​
-0.1199149​
218.397749​
0.0873591​
-547.27873​
-0.1094557​
227.716619​
0.09108665​
-520.43118​
-0.1040862​
232.56001​
0.093024​
-472.68963​
-0.0945379​
241.036919​
0.09641477​
-426.95008​
-0.08539​
249.140348​
0.09965614​
-383.05552​
-0.0766111​
256.899296​
0.10275972​
-340.86297​
-0.0681726​
264.337764​
0.10573511​
-300.24342​
-0.0600487​
271.47875​
0.1085915​
-261.08287​
-0.0522166​
278.341256​
0.1113365​
-223.27832​
-0.0446557​
284.944281​
0.11397771​
-186.73376​
-0.0373468​
291.303826​
0.11652153​
-151.36221​
-0.0302724​
297.43689​
0.11897476​
-117.08866​
-0.0234177​
303.354473​
0.12134179​
-83.839108​
-0.0167678​
309.069575​
0.12362783​
-51.549556​
-0.0103099​
314.595197​
0.12583808​
-20.157004​
-0.0040314​
319.941338​
0.12797654​
10.388548​
0.00207771​
325.116998​
0.1300468​
40.1421​
0.00802842​
330.131177​
0.13205247​
 
Last edited:
@PG Can you confirm what bar diameter and cover you are using for these latest results. Also concrete dimensions and steel and concrete strengths.
 
@PG Can you confirm what bar diameter and cover you are using for these latest results. Also concrete dimensions and steel and concrete strengths.
@IDS
I updated mine with your parameters. 36 mm dia r/f, steel strength 500 N/mm2, eff cover (from outer suface to r/f centre) = 57 mm, fck = 40 N/mm2. Column dimensions 250 (b) * 500 (h), NA angle = 5 degrees.
 
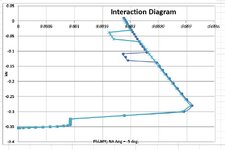
I get similar steps in the interaction diagram, although at different axial loads, so we must be doing something different:
IDS-MY3.jpg

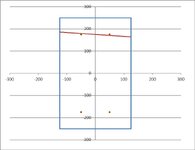
What is happening can be seen in the cross section below, which is for an axial load of -260 kN, which was the middle of my stepped zone:

Xsec1.jpg
The bottom of the compression block passes between the top two bars, so the one on the left has the full bar force, but the one on the right has the concrete stress deducted. This causes the step down in the bending moment, then as the axial load increases, and both bars are within the compression block, it steps back up again.
 
@IDS

Thank you for the response,

However, if we disregard the mismatch of the location of those "step/nose" like things, still your latest one (5 degree) is not even close to your previous (0 degree) one. It should be at least having a close representation of the below isn't it? or at that NA position (block passes between the top two bars) it should be like that and once you very near zero, it should get like a real curve? can you check if you get nice curve (without steps) near zero NA angle, may be 1 degree or even 0.5 degree?

IDS-MX3.jpg

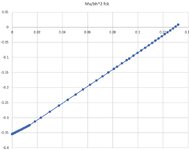
For me, the following are for 0.5 degrees. So, I don't get how you got nice curves like above at zero or near zero dgrees NA angle. May be I don't have generated sufficient data. may be I need to make the NA all the way to the bottom to get a nice curve. If you get a nice curve I should be able to get it as well. I don't understand why I don't get it.

Screenshot 2025-03-16 at 1.04.01 am.jpg

Screenshot 2025-03-16 at 1.03.47 am.jpg
 
@IDS

Thank you for the response,

However, if we disregard the mismatch of the location of those "step/nose" like things, still your latest one (5 degree) is not even close to your previous (0 degree) one. It should be at least having a close representation of the below isn't it? or at that NA position (block passes between the top two bars) it should be like that and once you very near zero, it should get like a real curve? can you check if you get nice curve (without steps) near zero NA angle, may be 1 degree or even 0.5 degree?

View attachment 6585

For me, the following are for 0.5 degrees. So, I don't get how you got nice curves like above at zero or near zero dgrees NA angle. May be I don't have generated sufficient data. may be I need to make the NA all the way to the bottom to get a nice curve. If you get a nice curve I should be able to get it as well. I don't understand why I don't get it.

View attachment 6587

View attachment 6586
Why are you comparing a plot of Mx for compressive axial loads with My for tensile loads, and expecting them to look the same?

Plotting Mx for compressive loads with 5 degrees skew of the NA looks identical to the plot for 0 degrees.

The plot of My for 0 degrees skew is exactly zero for all axial loads.

A small rotation of the NA generates irregular My results because the reinforcement is asymmetrical, relative to the NA, but the bending moments are tiny, and it makes very little difference to Mx, or the resultant moment.

@IDS
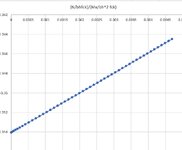
I'm confused. I'm comparing standard chart curve for x axis (compression + tensile), with the generated chart curve for x axis (compression + tensile).
So, that means I'm comparing apples to apples.
Why are you saying I'm comparing two different things? It's the same "(N/bhfck)/(Mx/bh^2 fck)" charts, with the same parameters. That's why I'm expecting it to be same.

My goal here is to generate curves similar to shown in the standard 0.15 chart.
Both of the following diagrams are zero or very close to zero (0.5 degrees), I'm asking why they aren't same if my calculations aren't wrong. You got it perfectly matched and I just get a straight line. Either I'm doing something wrong plotting with wrong data points, or my calculation is wrong. I'm trying to understand how you got aligned with the following chart, and I don't. May be you used complete different calculation (solely made for uni axial) than using the same biaxial excel sheet and set to zero degrees?

Screenshot 2025-03-16 at 2.33.45 pm.jpg
Screenshot 2025-03-16 at 2.31.25 pm.jpg
 
But the graph has a tiny range of axial loads close to the tensile capacity of the section. The N/bhfck plotted is -0.354 to -0.342, and you are comparing to a range 0 to 1.2. Try a plot with the same axial load range.
 
@IDS

Thank you for the responses and the excel sheet. I'll go through it.

Apparently, you have disregarded the "reduced at pure compression" clause , and just introduced zero moments, just after column enters the pure compression. That's why your charts and standards charts have a horizontal straight line. Am I correct or wrong?

Further, my chart looks like it almost made it to the 0.4 line, but still not fully aligning. I wonder how yours aligned when our calculations are the same. Any suggestions to check to rectify this?

Screenshot 2025-03-18 at 10.07.31 pm.jpg
 
Last edited:
@IDS

Thank you for the responses and the excel sheet. I'll go through it.

Apparently, you have disregarded the "reduced at pure compression" clause , and just introduced zero moments, just after column enters the pure compression. That's why your charts and standards charts have a horizontal straight line. Am I correct or wrong?
By the "reduced at pure compression" clause do you mean the requirement to reduce the maximum compression strain to 0.00175 or 0.002? If so, why do you think I have "neglected" it? The input allows you to enter the strain under maximum compression, and that is used in calculating the maximum axial load capacity.

My charts don't have a horizontal straight line, although possibly the interaction diagram doesn't always plot correctly under high axial loads.

The charts from the book have a short horizontal section at the top, which I presume is because they have limited the axial load to the value that allows the minimum eccentricity bending moment, although for the lower reinforcement ratios the moments shown seem too low.

@IDS

Thank you for the response.

Further, my chart looks like it almost made it to the 0.4 line, but still not fully aligning. I'm confused how yours aligned when our calculations are the same. Please provide any suggestions to check to rectify this. What should I check?

Screenshot 2025-03-18 at 10.07.31 pm.jpg
Can you attach a file with your calculations? That would be the quickest way to find where the difference is coming from.
 
Can you attach a file with your calculations? That would be the quickest way to find where the difference is coming from.

I will prepare an individual excel sheet.
Mean while, can you please confirm if your chart below used the 0.9 reduction factor on fcd or it's without applying it?. When I remove the 0.9 reduction. My chart aligns with the standard chart. But when I apply it, it does not.

1742346761148.png
 
I will prepare an individual excel sheet.
Mean while, can you please confirm if your chart below used the 0.9 reduction factor on fcd or it's without applying it?. When I remove the 0.9 reduction. My chart aligns with the standard chart. But when I apply it, it does not.

View attachment 6739
The text doesn't say anything about the 0.9 factor, so we can assume they didn't apply it. The charts are for rectangular sections bending about their principal axes, so there is no reason why they would have applied it. My calculations fitting the chart also did not apply it.
 
The text doesn't say anything about the 0.9 factor, so we can assume they didn't apply it. The charts are for rectangular sections bending about their principal axes, so there is no reason why they would have applied it. My calculations fitting the chart also did not apply it.

Thank you for the response.

Now I get it.
What I still don't get is, how their chart is almost horizontal after the pure compression occurs. If they followed Eurocodes, there should be a drop as it caps at 0.00175 or 0.002. If their line is perfectly horizontal, we could have guessed they have just ignored the concentric behaviour. But it's not perfectly horizontal, that means they have not ignored concentric behaviour. But they get almost horizontal line and i get a drop after pure compression. So, they are following different type of calculation after the pure compression. Wonder what is more precise.
 

Part and Inventory Search

Sponsor