FlameOfAnor
Student
Hi I hope I find you all in good health.
I have been performing microstructural analysis on a few mild steel 1018 samples as I need them for my experiments. My aim is to look for homogeneity in the microstructure and also check for the grain size. In my trials I came across something interesting but I could not find a suitable explanation for it.
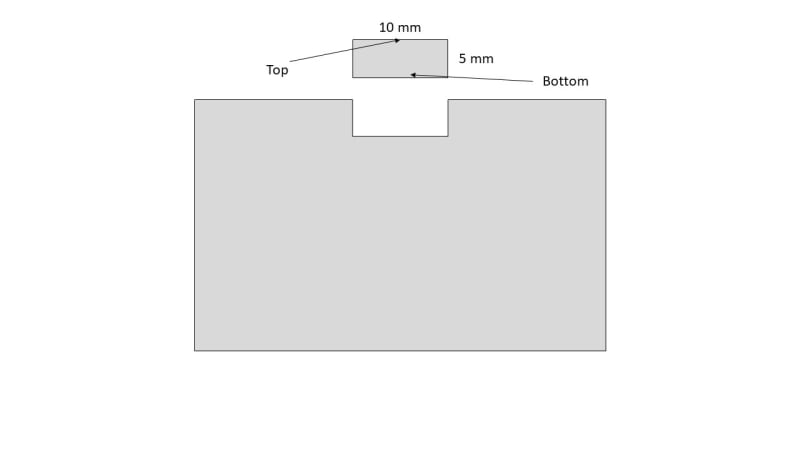
First I should describe my samples. I cut a segment from each of my samples and etched with Nital solution. Then I took microscopic images of the 'top' and 'bottom' parts of the segment. This is shown below.
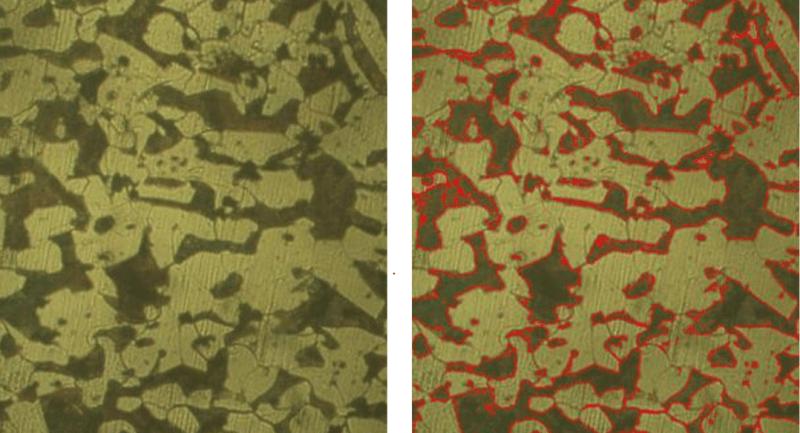
This particular steel is expected to have ferrite - pearlite microstructure. Using image processing done in MATLAB based on a color threshold I was able to calculate the relative percentage of either of them. I have shown an example of this below.
I compared if there is a difference between the percentage obtained on the 'top' and 'bottom' for 3 samples. I observed that the percentages of ferrite and pearlite obtained on the 'bottom' of all three as the same. But when it comes one particular sample I observed that there is a significant difference. I have shown this in the bar chart below
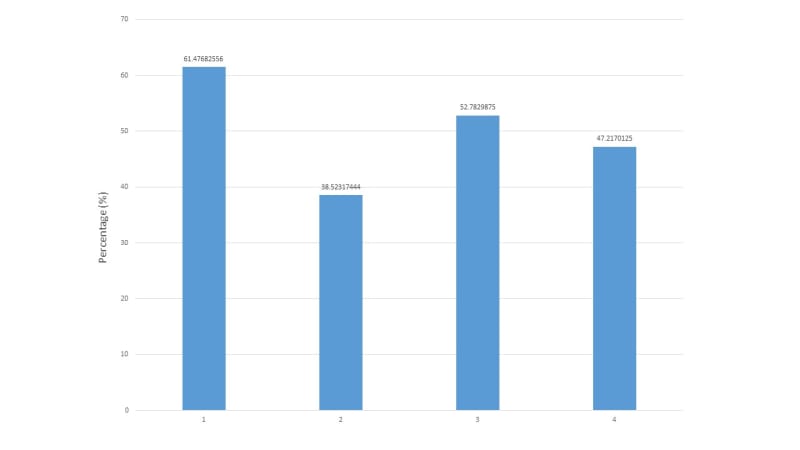
Here '1' indicates percentage of ferrite on 'top', '2' indicates percentage of pearlite on 'top', '3' indicates percentage of ferrite on 'bottom' and '4' indicates percentage of pearlite on 'bottom'. My first thought was that the image processing algorithm mistakenly identified the phases but even after changing threshold value I kept getting the same trend.
So my doubt now is, is this trend indicative of an annealing (softening) on the surface as the ferrite (softer phase) is dominant than pearlite? As someone who doesn't have a background in material science I am not able to get any related results in literature. I am also not sure whether such a conclusion can drawn from an analysis as I am not coming across this in literature. I would not have thought about carrying the analysis forward if it was not for the other two samples in which the percentage obtained were same for 'top' and 'bottom'.
Can you guys provide your thoughts on this?
I have been performing microstructural analysis on a few mild steel 1018 samples as I need them for my experiments. My aim is to look for homogeneity in the microstructure and also check for the grain size. In my trials I came across something interesting but I could not find a suitable explanation for it.
First I should describe my samples. I cut a segment from each of my samples and etched with Nital solution. Then I took microscopic images of the 'top' and 'bottom' parts of the segment. This is shown below.
This particular steel is expected to have ferrite - pearlite microstructure. Using image processing done in MATLAB based on a color threshold I was able to calculate the relative percentage of either of them. I have shown an example of this below.
I compared if there is a difference between the percentage obtained on the 'top' and 'bottom' for 3 samples. I observed that the percentages of ferrite and pearlite obtained on the 'bottom' of all three as the same. But when it comes one particular sample I observed that there is a significant difference. I have shown this in the bar chart below
Here '1' indicates percentage of ferrite on 'top', '2' indicates percentage of pearlite on 'top', '3' indicates percentage of ferrite on 'bottom' and '4' indicates percentage of pearlite on 'bottom'. My first thought was that the image processing algorithm mistakenly identified the phases but even after changing threshold value I kept getting the same trend.
So my doubt now is, is this trend indicative of an annealing (softening) on the surface as the ferrite (softer phase) is dominant than pearlite? As someone who doesn't have a background in material science I am not able to get any related results in literature. I am also not sure whether such a conclusion can drawn from an analysis as I am not coming across this in literature. I would not have thought about carrying the analysis forward if it was not for the other two samples in which the percentage obtained were same for 'top' and 'bottom'.
Can you guys provide your thoughts on this?