Continue to Site

Eng-Tips is the largest engineering community on the Internet

Intelligent Work Forums for Engineering Professionals

  • Congratulations SSS148 on being selected by the Eng-Tips community for having the most helpful posts in the forums last week. Way to Go!

Composite Panel Buckling Load 1

Status
Not open for further replies.

midsidenode

Mining
Sep 18, 2006
85
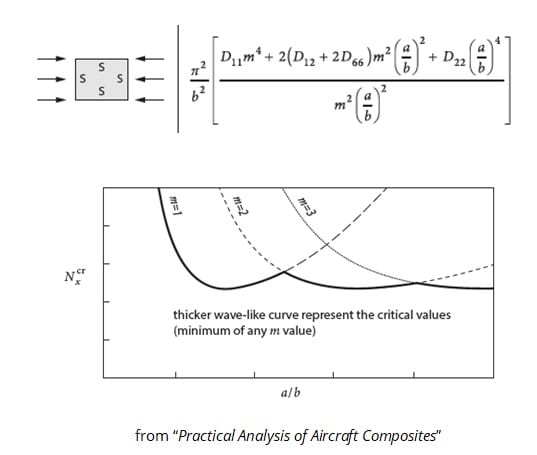
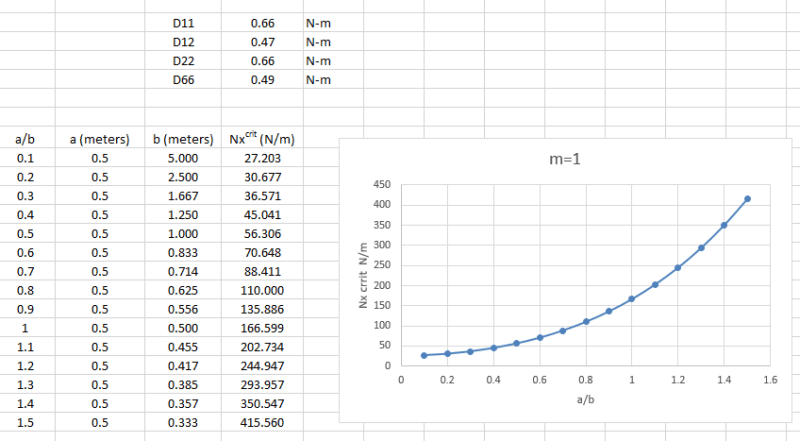
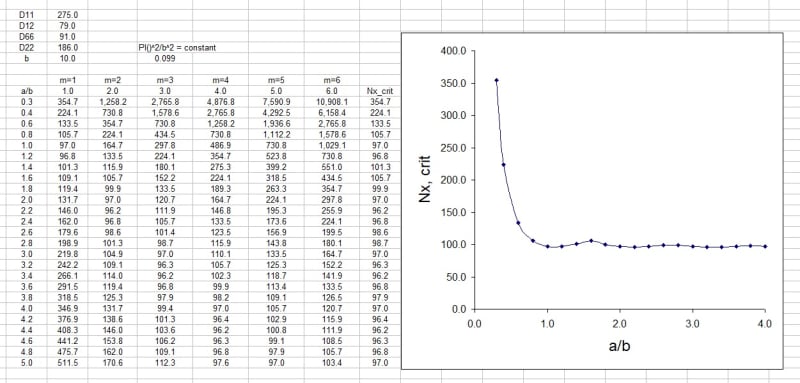
Can someone help me here? I may be having a brain fart. Please take a look at the enclosed figure involving buckling of a panel in pure compression with 4 simply supported sides. How is the enclosed Figure obtained? My plot of the allowable buckling load vs the aspect ratio looks nothing like this but this is indeed what a typical buckling load chart looks like. For example, for an aspect ratio of 1, the allowable buckling load is obviously .161 N/mm for this case. What am I doing wrong here? Just assume m=1.
 
 https://files.engineering.com/getfile.aspx?folder=8a90641b-4d27-4faa-b179-1ededd9ad8f6&file=panel.png
Replies continue below

Recommended for you

For each a/b ratio, you need you solve for m=1,2,3...and take the minimum value. For lower a/b, m=1 is usually the critical value, but as a/b increases it will go to m=2 or greater. You should get a solution like the attached (for uni-axially loading). For shear loading, it is a smooth curve and does not have a "wave-like" result.

wave_wcy4he.jpg


Brian
 
Brian,
With the equation that you provided, keep the dimension of the plate parallel to the load at a=.5 meters and vary the plate width from b=5 meters to b=.333 meters. Just keep m=1 half waves. Then plot Nx(crit) vs a/b and see that you get the same curve that is enclosed. Why doesn't this look like a typical buckling curve? In other words, as a/b approaches zero, Nxcrit should go to infinity. Does Nx(crit) need to be normalized as stress before it's converted to running load (N/m)?

Nx_crit_vs_AR_asgac0.png


v/r,
msn

 
Perhaps your order of operations is incorrect in Excel (it can sometimes be tricky and difficult to spot). Here is my sample problem. I did not double check it, but it looks as expected.

excel_calcs2_cuwqjw.jpg


Brian
 
I guess that is an interesting thing. To get these curves correct, one must ensure that the plate width (b) is held constant and the plate length (a) is changed. Thanks Brian.
 
Yeah, while the form I posted can be condensed as you showed, it may be less intuitive if you do so (potentially causing some confusion as to how to generate the curve). Also, the form I posted is more typically presented in publications and more aligned with the solution for metals.
 
Status
Not open for further replies.

Part and Inventory Search

Sponsor